U.S. Citizenship Applications Rebound in Fiscal Year 2023 to Pre Pandemic Levels — Visa Lawyer Blog — January 22, 2024
According to recent data released by the U.S. Citizenship and Immigration Services (USCIS), applications for U.S. Citizenship surpassed pre-pandemic levels in fiscal year 2023, welcoming 878,500 new citizens from all over the world.
To be eligible for naturalization, applicants must meet certain eligibility requirements set forth in the Immigration and Nationality Act (INA).
The requirements generally include being a lawful permanent resident (LPR) for at least five years or at least three years for spouses of U.S. Citizens. Applicants must establish that they have good moral character, have continuously and physically resided in the United States as a green card holder, be proficient in basic spoken and written English, pass the required civics and English examination, among other requirements. Please note that there are other special naturalization provisions that exempt certain applicants, including certain spouses of U.S. citizens and applicants with military service, from one or more of the general requirements for naturalization.
Here are some of the highlights of Naturalization statistics in fiscal year 2023.
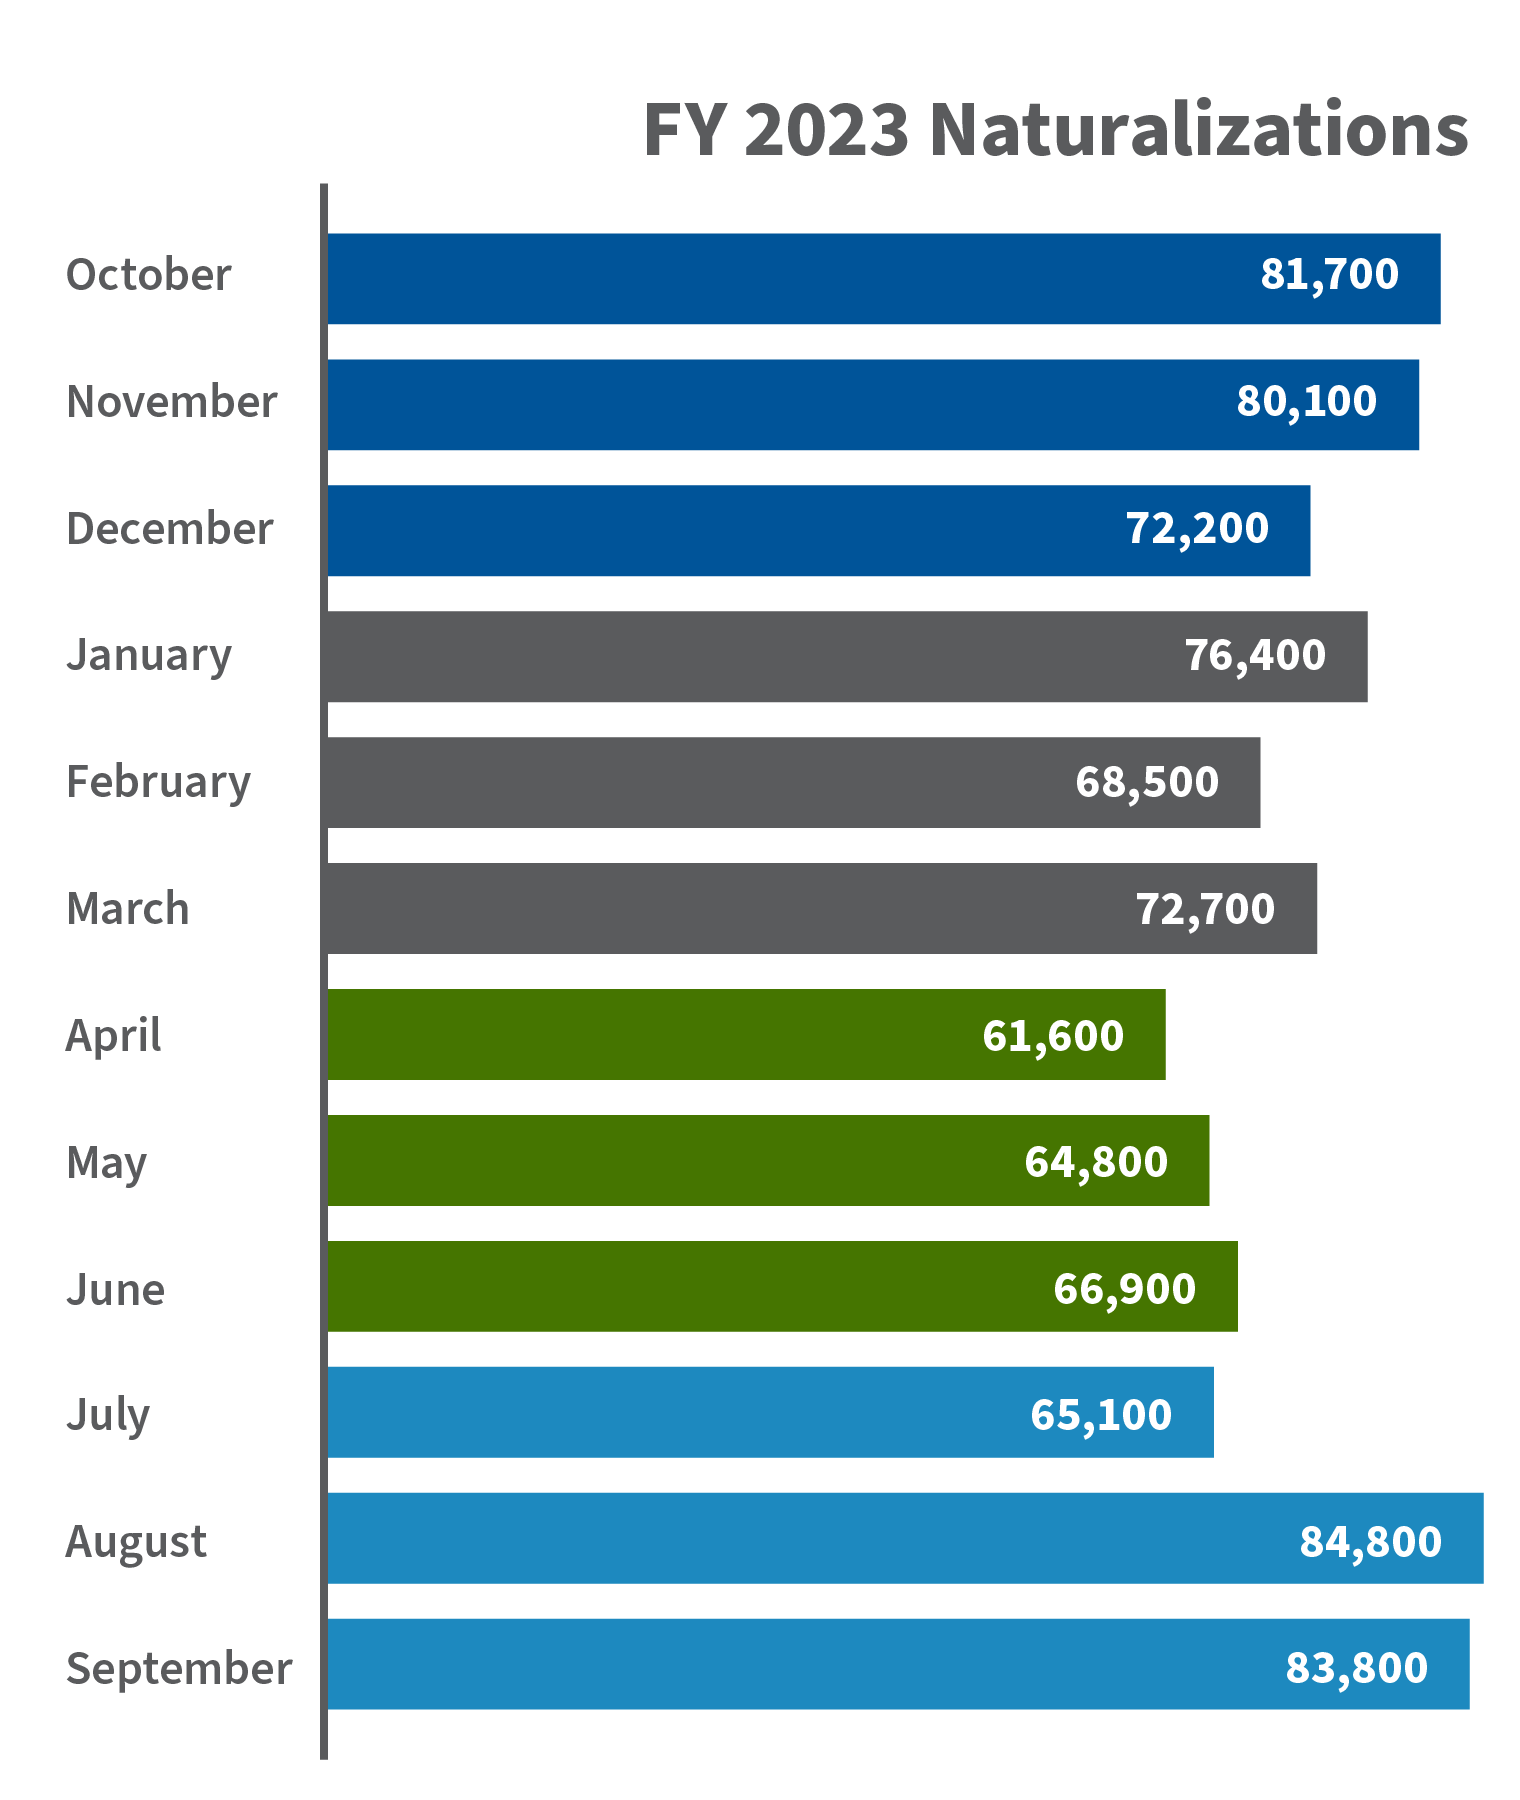
Naturalization Applications in FY 2023 By Month
- August and September 2023 boasted the highest number of naturalization applicants at more than 168,600 applications in those months combined.
- Field Offices: The Dallas (4.1% of all naturalizations), Houston (4.1%), Chicago (3.7%), Newark (3.4%), and San Francisco (2.9%) field offices were responsible for naturalizing the largest number of new citizens in FY 2023.
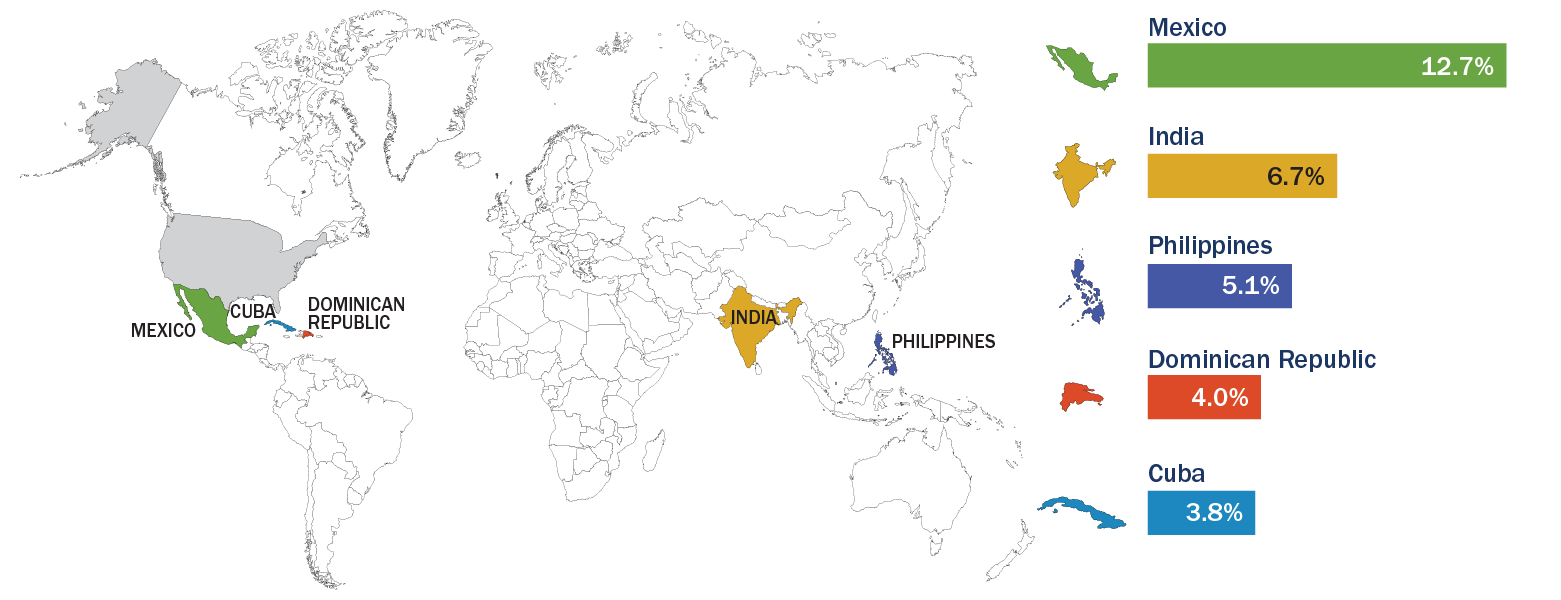
- Top Countries: The top five countries of people naturalizing in FY 2023, were Mexico with 12.7% of all naturalizations, followed by India (6.7%), the Philippines (5.1%), the Dominican Republic (4.0%), and Cuba (3.8%). Altogether these countries made up 32% of naturalized citizens in FY 2023.
- Geographic regions: Of all citizens naturalized in FY 2023, 70% resided in 10 states (in descending order): California, Texas, Florida, New York, New Jersey, Illinois, Washington, Pennsylvania, Massachusetts, and Virginia. More than 50% resided in the top four states.
- Top Cities: The top five cities (including boroughs) where people who naturalized resided were (in descending order): Brooklyn, Miami, Houston, the Bronx, and Los Angeles.
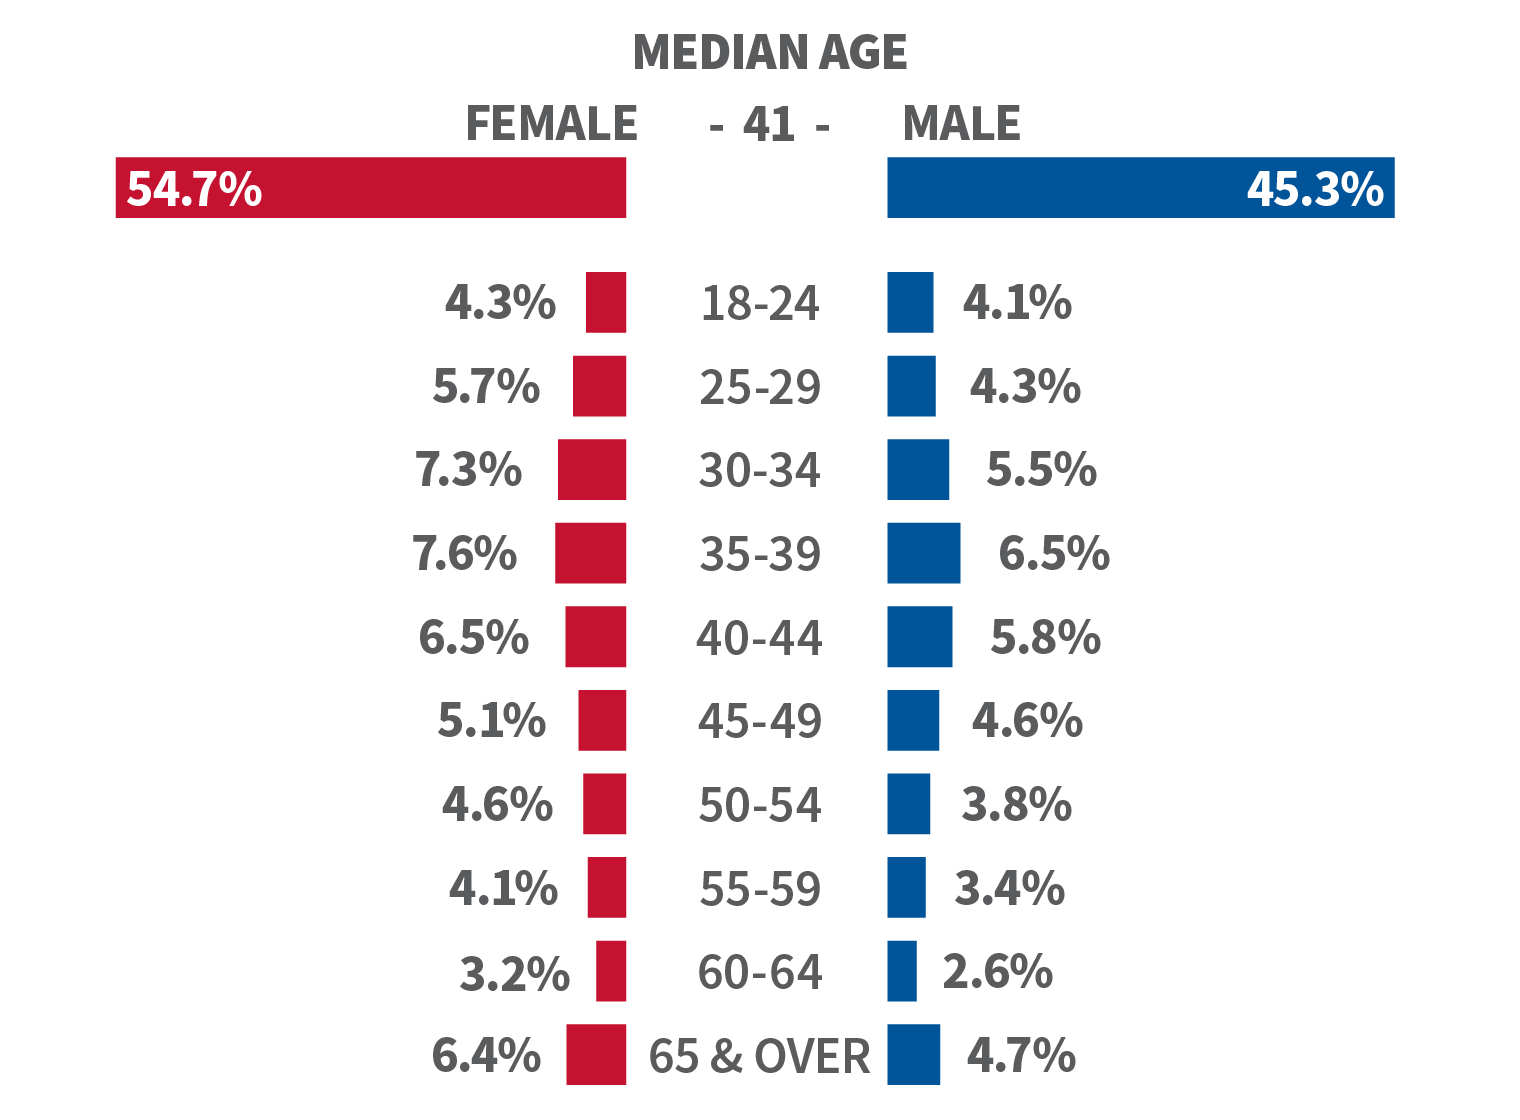
- Age: More than 39% of citizens naturalized in FY 2023 were 30 to 44 years old.
- Gender: Women made up nearly 55% of those naturalized in FY 2023, and they were the majority in every age group.
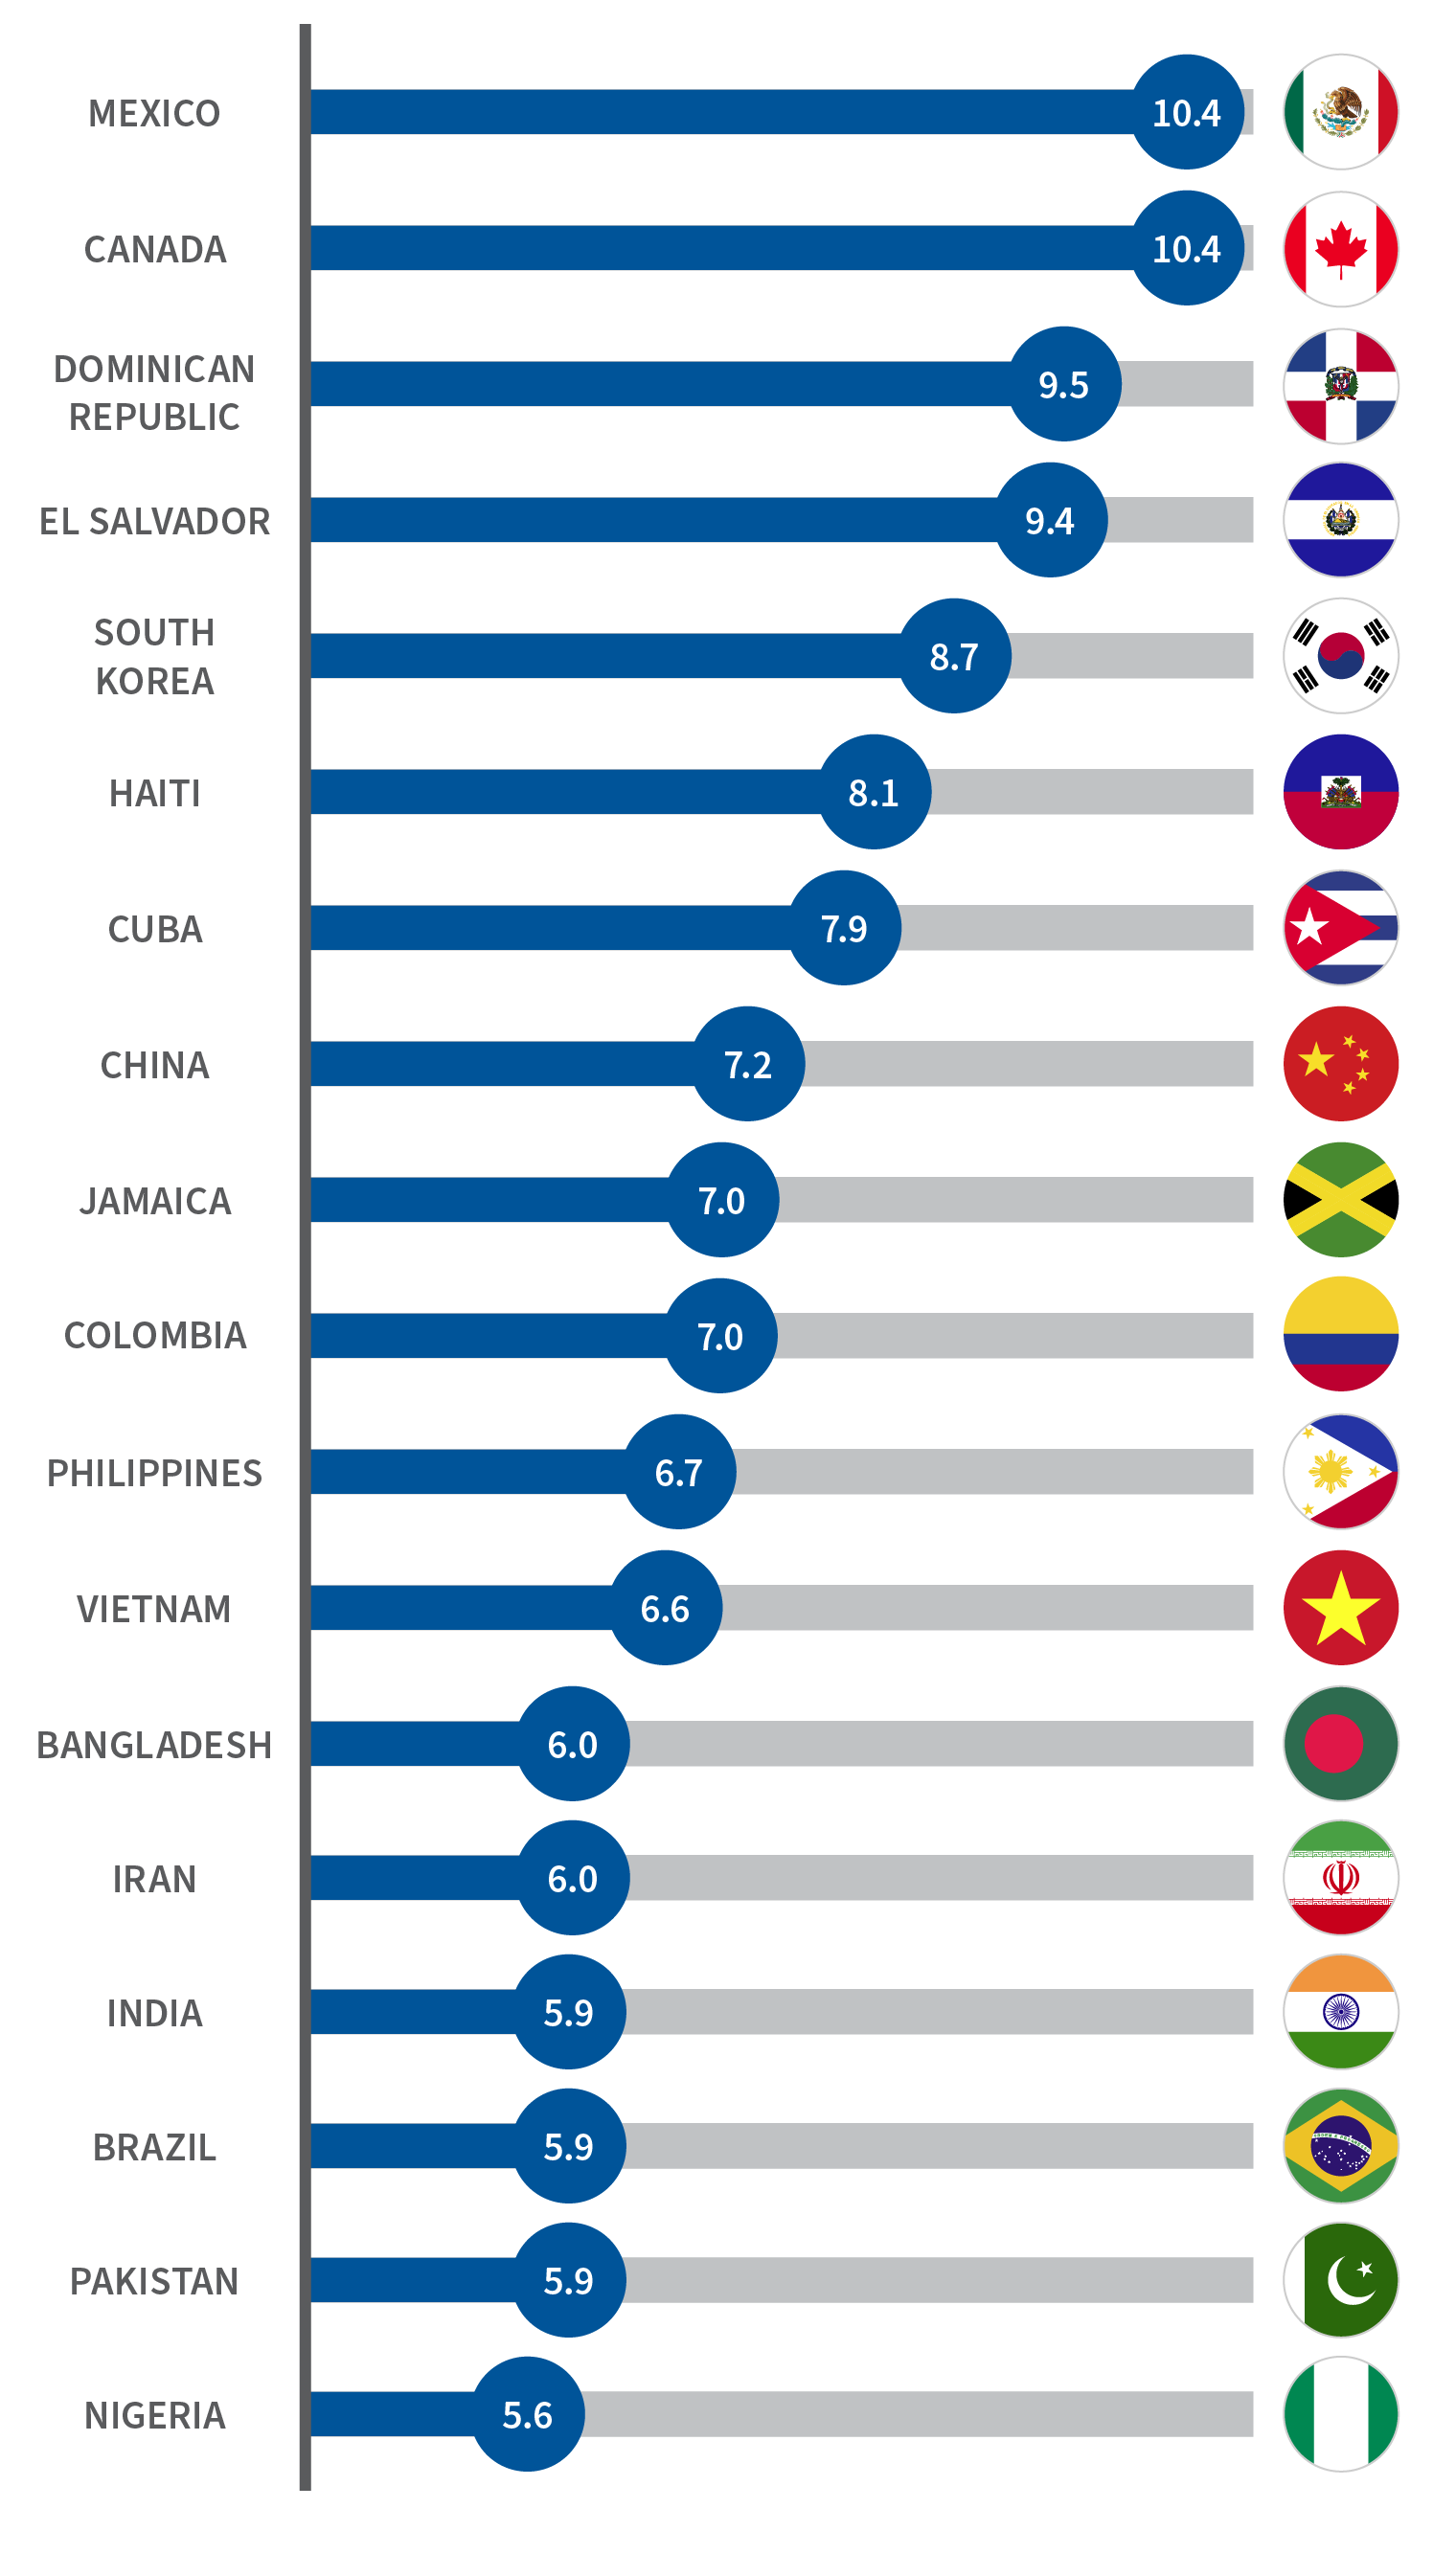
- Time Spent as an LPR: The median years spent as an LPR varied by the citizens’ country of birth. The countries with the largest number of new citizens in FY 2023 and their median years spent as an LPR are shown below. Out of these top countries, applicants from Mexico and Canada spent the longest time, with 10.4 years, and applicants from Nigeria spent the shortest, with 5.6 years.
The top five countries of people naturalizing in FY 2023
Years as an LPR by Country
Median age and gender of people naturalizing in FY 2023
Eligibility for Naturalization
The majority of people who naturalized in FY 2023 were eligible for naturalization based on being LPRs for at least 5 years (INA Section 316(a)), followed by applicants who were eligible based on being LPRs for at least 3 years and married to a U.S. citizen for 3 years (INA Section 319(a)) and applicants who were eligible based on their military service during a designated period of hostilities (INA Section 329) as follows:
| Section of Law | Section of Law Description | Percent of Total |
| INA Section 316(a) | LPR for 5 years | 82.9% |
| INA Section 319(a) | LPR for 3 years (married to U.S. citizen 3 years) | 15.6% |
| INA Section 329 | Military service during designated period of hostilities | 1.4% |
| All other | All others | 0.1% |
For more information about these statistics, please click here.
Contact Us. For help filing your application for naturalization or any other immigration matter, please text 619-569-1768 or call 619-819-9204 for a consultation.
Helpful Links
JOIN OUR NEW FACEBOOK GROUP
Need more immigration updates? We have created a new facebook group to address the impact of the new executive order and other changing developments related to COVID-19. Follow us there.
For other COVID 19 related immigration updates please visit our Immigration and COVID-19 Resource Center here.


