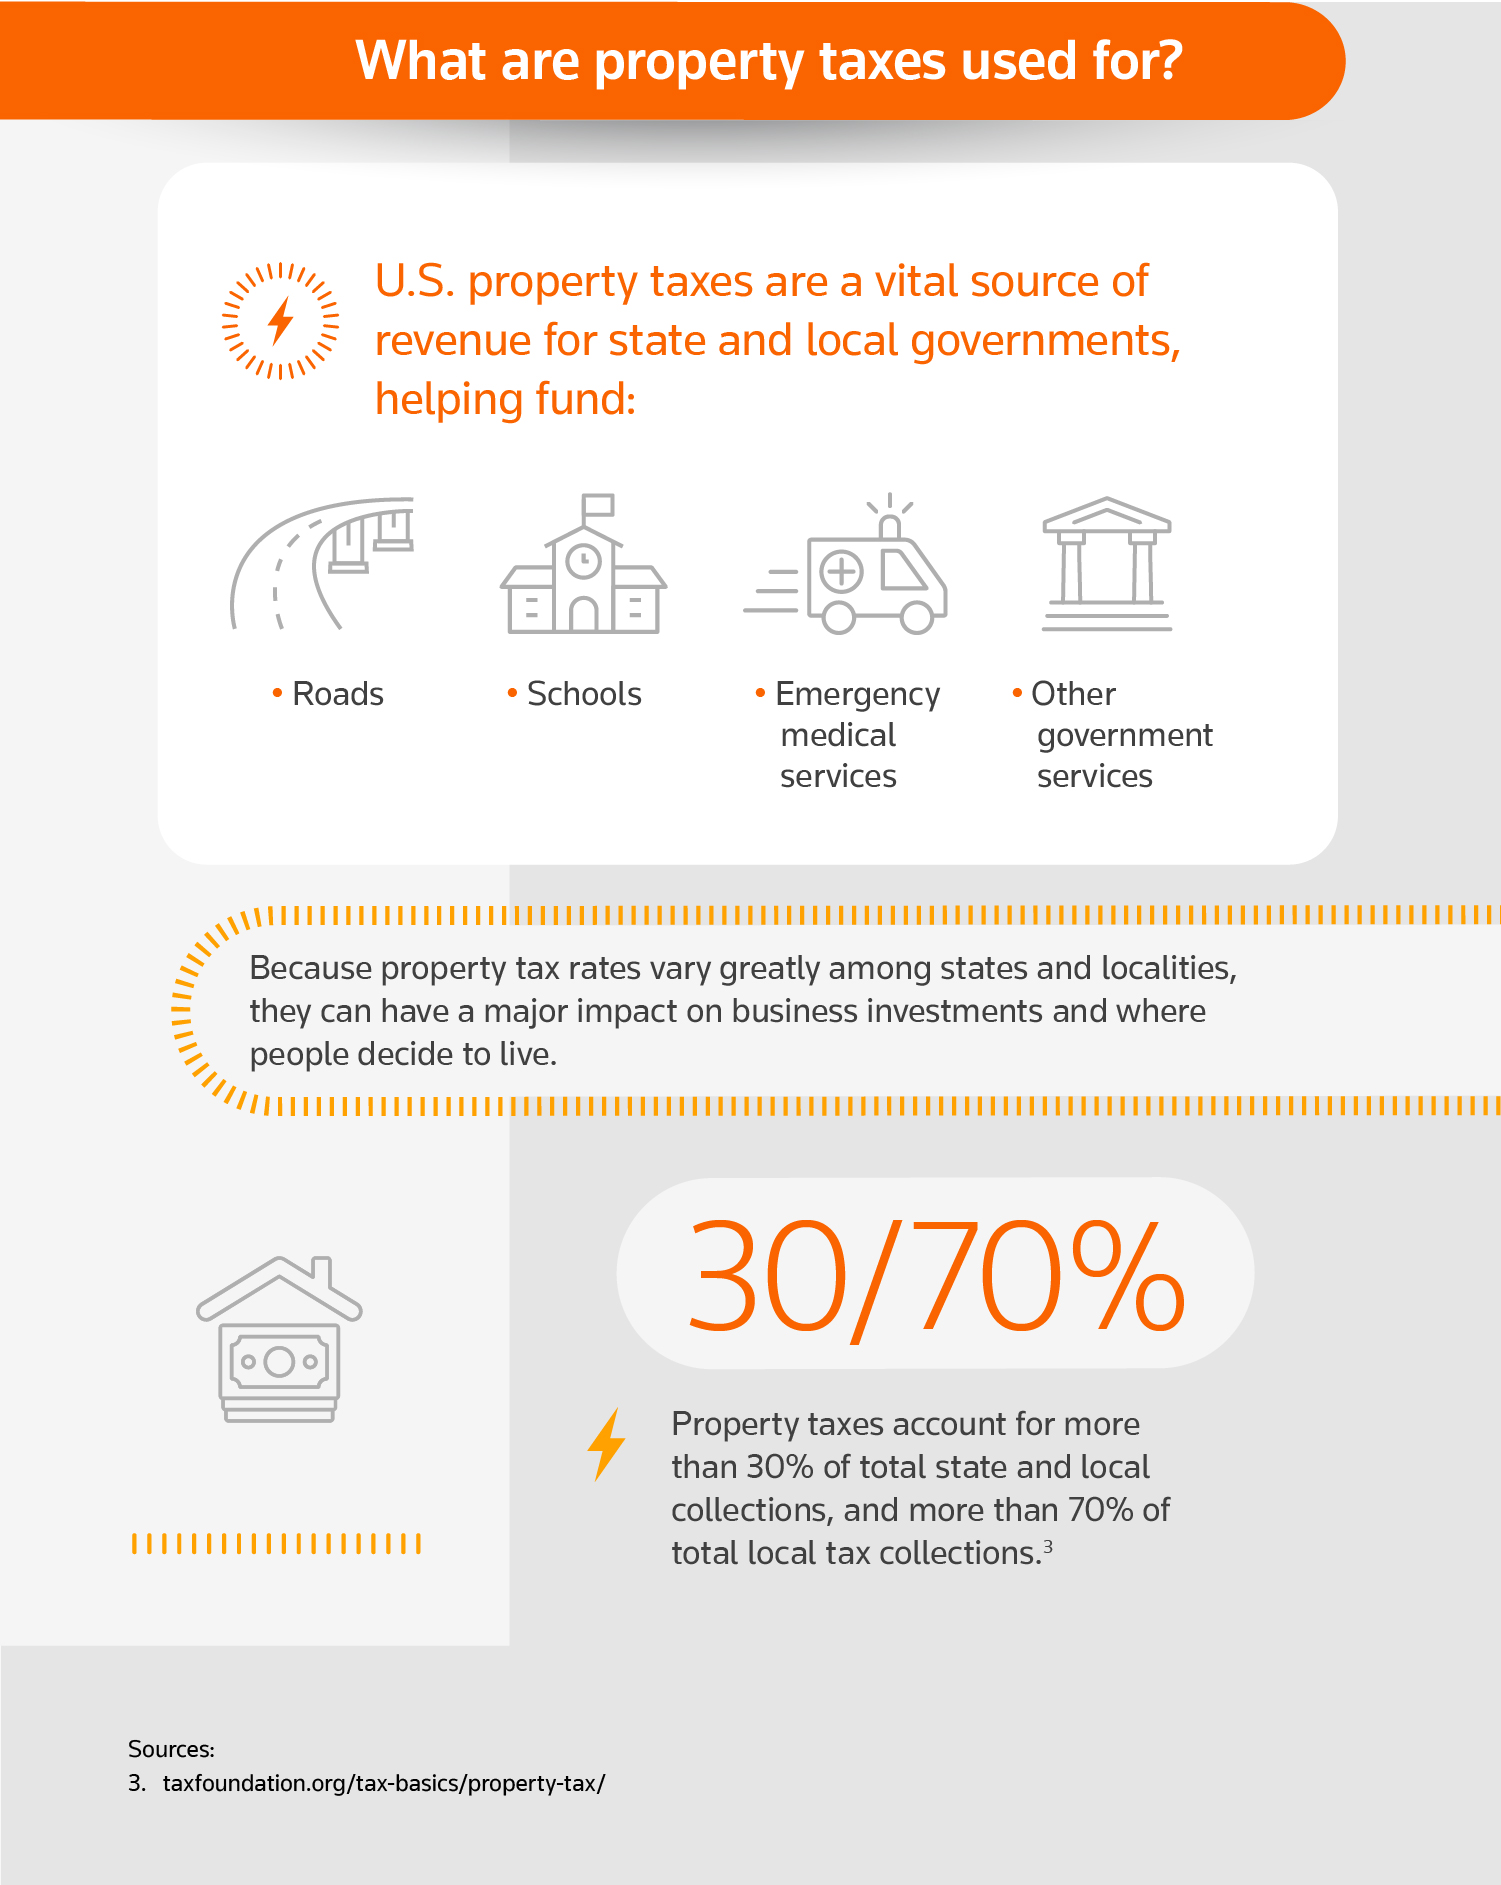
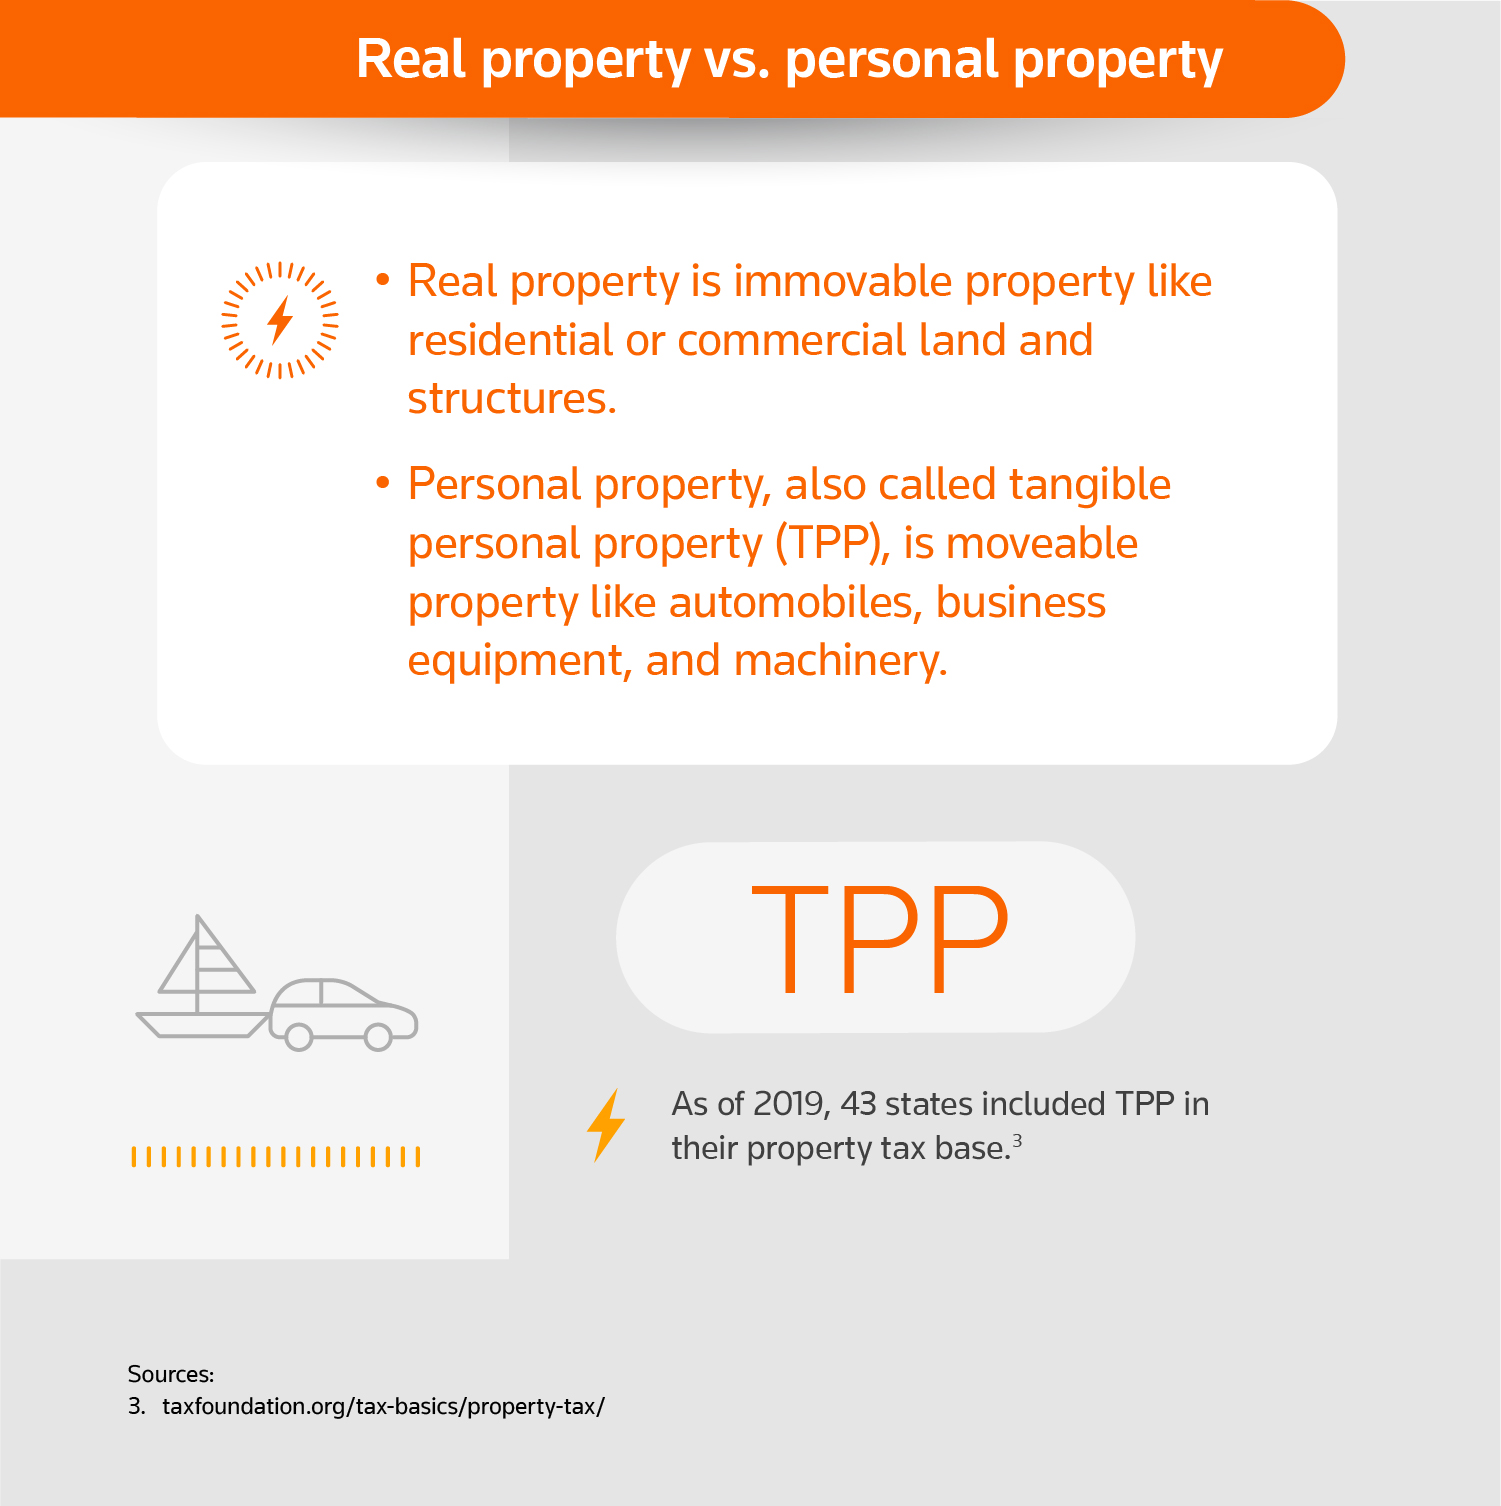
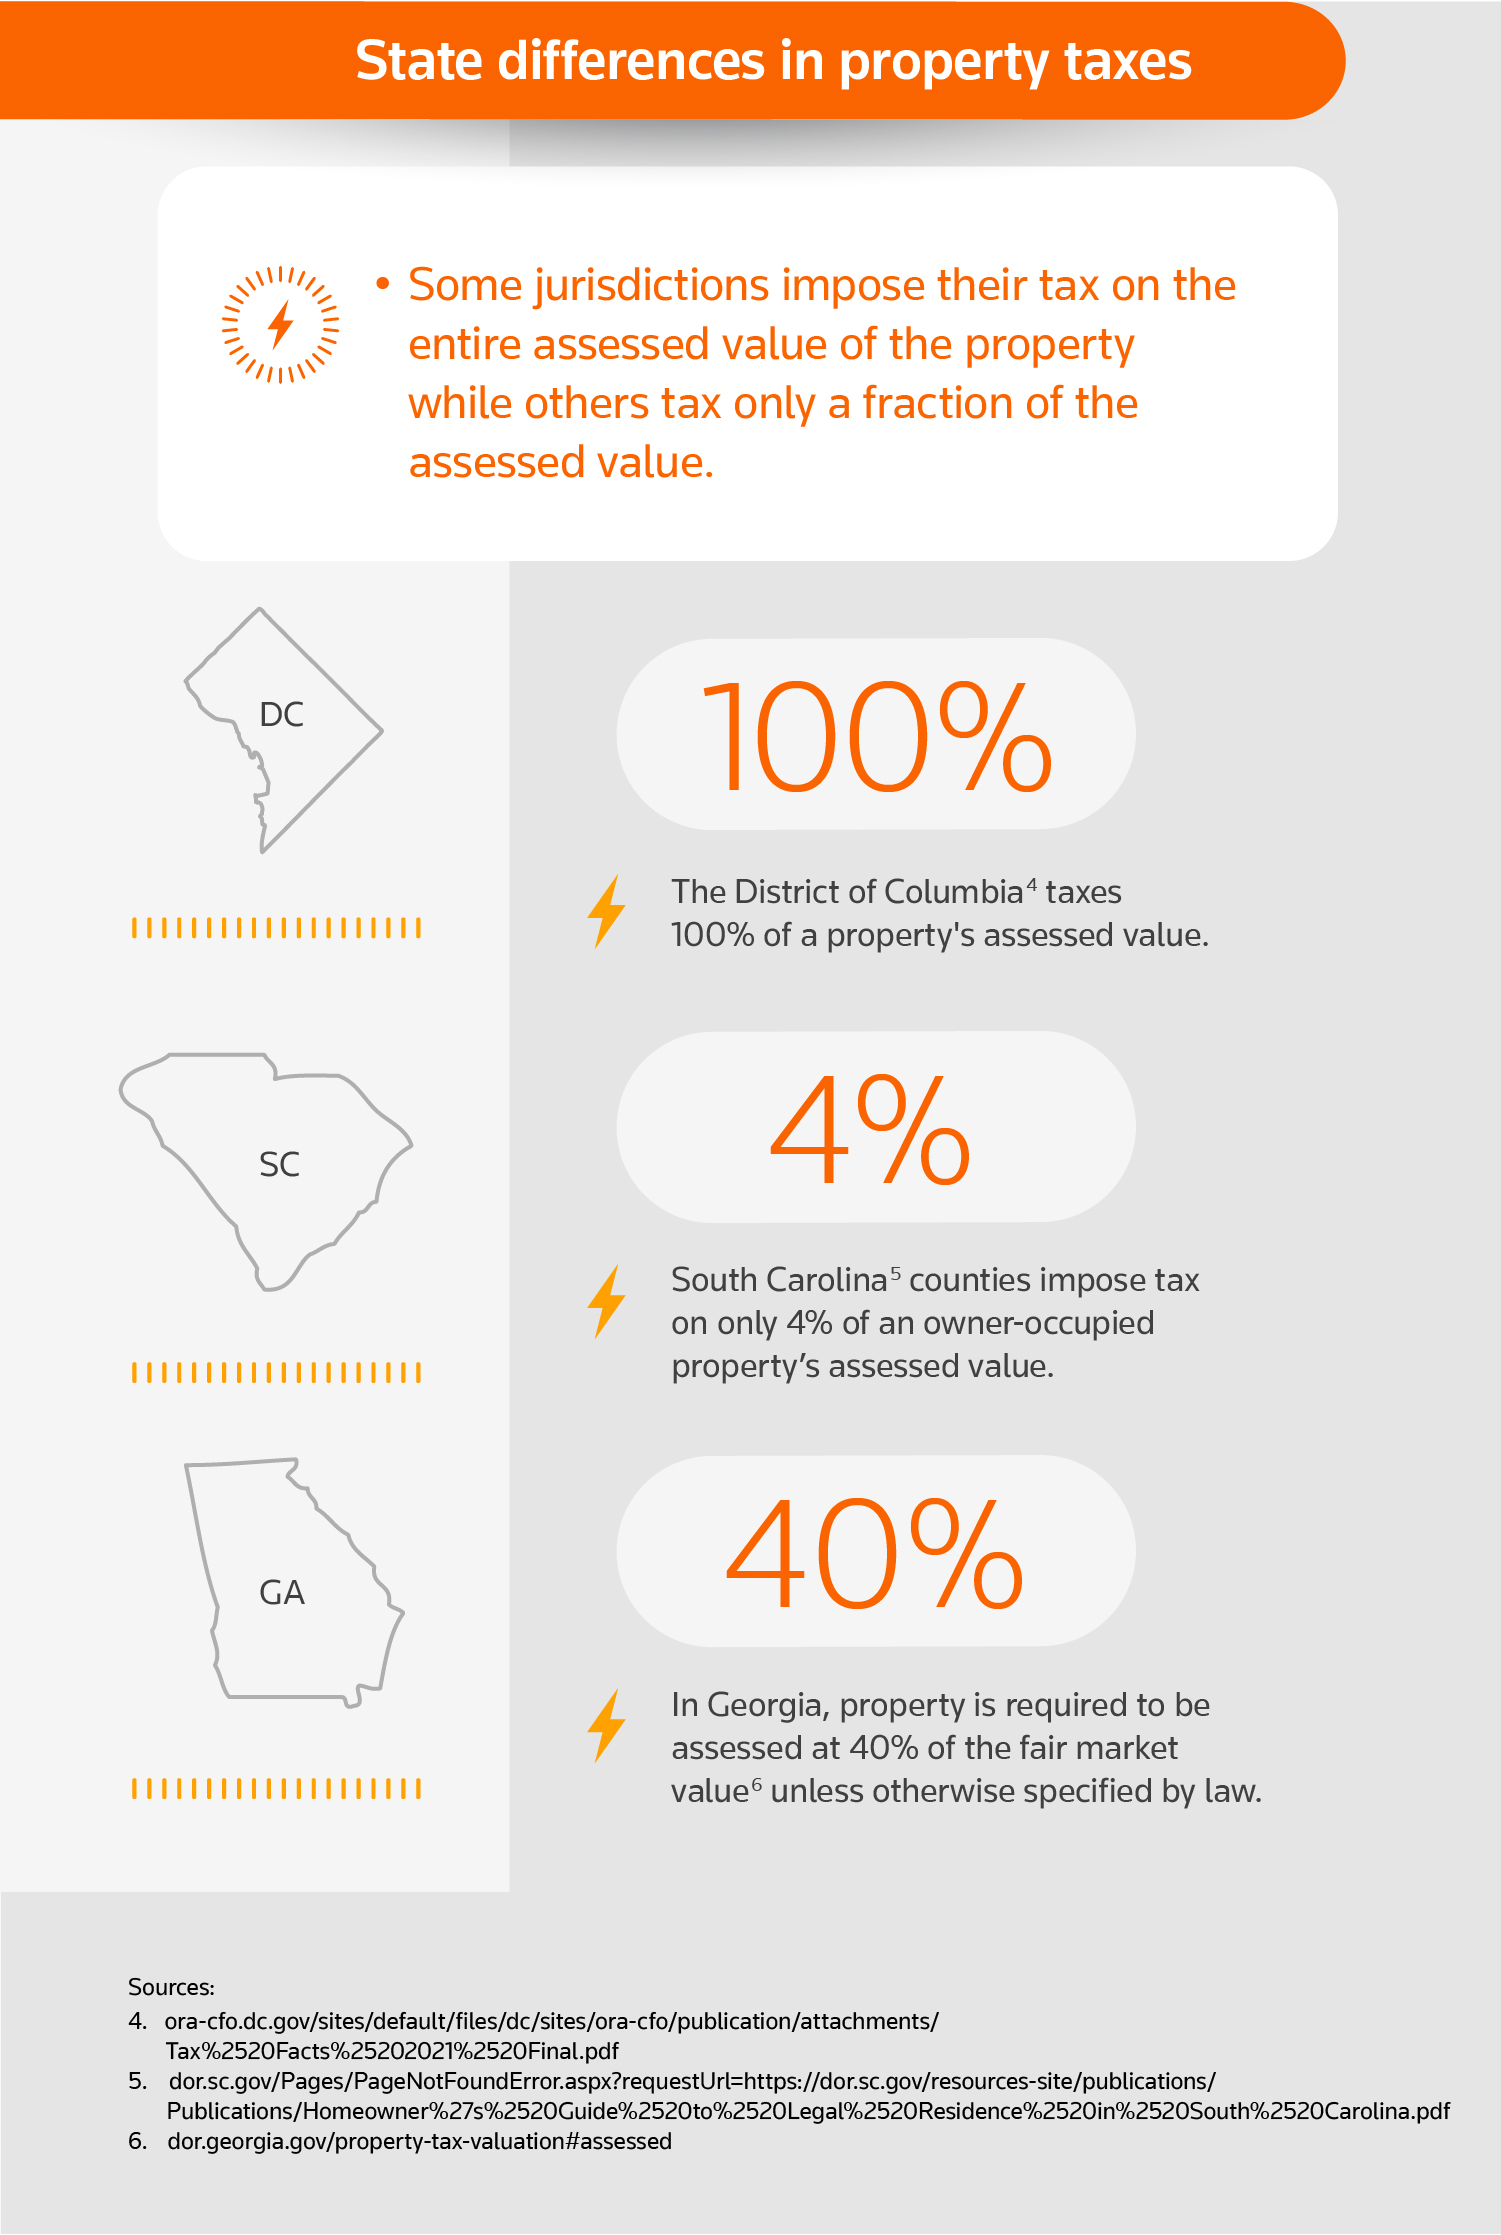
Property tax 101 [infographic]
Helping clients navigate the complexities of property tax is important for accounting firms. Property taxes and tax rates, which vary greatly among states and localities, can be confusing and are a major area of tax exposure and risk. Firms can strengthen their role as a trusted advisor by helping clients effectively manage their property taxes and mitigate risk.
Below is an infographic covering the current state of property taxes in the United States, but first, let’s take a brief look at the history of property tax.
History of property tax
The origination of property taxes in the United States dates back to colonial times. During this time, the rise of property tax was closely tied to political and economic plights on the frontier.
When tensions between colonists and British authorities hit a boiling point and the Revolutionary War broke out in 1775, American colonies had a tax structure in place that varied from colony to colony.
By 1796, seven of the 15 states levied uniform capitation taxes, which were taxes (also known as a “poll” or “head” tax) levied on individuals regardless of their income or resources. Twelve states taxed some or all livestock. Meanwhile, land was taxed in a variety of ways, but only four states taxed the mass of property by valuation. No state constitution required that taxation be by value or required uniformity on rates on all kinds of property; however, that would soon begin to change.
In 1818, Illinois adopted the first uniformity clause and additional states soon followed suit. Tennessee replaced a provision requiring that land be taxed at a uniform amount per acre with a provision that land be taxed according to its value. More and more states began adopting uniformity clauses and, by the end of the century, 33 states had included uniformity clauses, which required all property be taxed equally by value.
Modern reforms of property tax
Going forward, measures to reform the property tax were different depending on the state, but usually included exemption or classification of some forms of property. Intangibles like mortgages were usually taxed at lower rates, but in several states tangible personal property and real estate were also classified.
During the 1900s, some states exempted owner-occupied residence from taxation. However, these homestead exemptions would later be criticized.
Following World War II, many states replaced the homestead exemption with state financed “circuit breakers” to limit or reduce taxes for certain individuals. By 1991, 35 states had some form of circuit breakers in place.
In the late 1970s, a taxpayer revolt swept the country. The most publicized was Proposition 13, a constitutional amendment passed in California in 1978. Under Proposition 13, all real property has established base year values, a restricted rate of increase on assessments of no greater than 2% each year, and a limit on property taxes to 1% of the assessed value (plus additional voter-approved taxes).
Today, advancements in technology have improved state assessment techniques to help make reasonably accurate property. Now, let’s turn to the infographic for a quick overview of how property taxes look today.
Learn more about property taxes
Property taxes are unique to state and local governments, so helping clients can become complicated quickly. For more information and answers to frequently asked questions about property taxes, read our guide “

![Property tax 101 [infographic] Property tax 101 [infographic]](https://tax.thomsonreuters.com/blog/wp-content/uploads/sites/17/2023/02/TR2958290_01A_1501x1732.jpg)


![H-1B Master’s Cap Complete Guide: Increase Your Odds [2023-24] H-1B Master’s Cap Complete Guide: Increase Your Odds [2023-24]](https://www.immi-usa.com/wp-content/uploads/2022/03/Screen-Shot-2022-03-28-at-1.54.27-PM-300x225.png)


