A Look at the Most Active Patent Litigators and the Latest District Court Patent Litigation Data
“Companies may employ various strategies, including utilizing intellectual property rights in pre-litigation or ITC investigations to obtain injunctions, but the most popular venue for patent litigation remains U.S. district courts.”
As economists predict market slowdowns, companies focus on the need to protect their market share by enforcing their intellectual property (IP) rights or possibly monetizing it to bring value to their balance sheet. A company’s value, reputation, and success can be directly tied to its intellectual property, and therefore, it is critically important to safeguard that IP. According to the United States Patent and Trademark Office (USPTO), economic growth is driven by innovation and supported through intellectual property. Thus, it is essential that we study the relationship that exists between innovation-related growth and the trends in IP data.
Using its own proprietary technology, Patexia has developed the ability to read all intellectual property complaints and automatically detect case type (i.e. patent, trade secrets, etc.), as well as automatically extract all patents and parties involved in the case. The technology reduces the chance of error and also increases the speed of data extraction and the number of data fields that can be extracted.
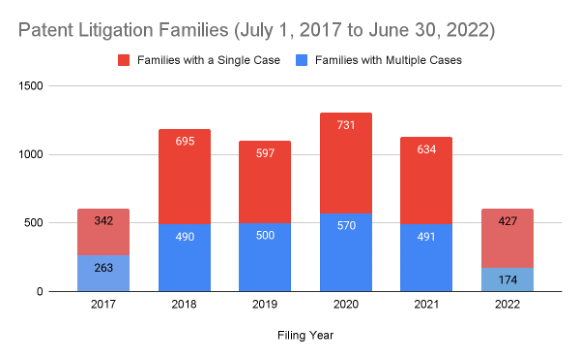
This year’s Patexia Patent Litigation Report features a wide range of updates and improvements, from changes to the ranking methodology to the introduction of the concept of a “patent litigation family.” Patent litigation can often span multiple legal venues and transcend international borders. While examining a single case can provide some insight, it may not offer a comprehensive understanding of the overall strategies of all parties involved. Additionally, looking solely at case volume can be misleading, as many cases may be filed based on the same group of patents. In light of this, Patexia has introduced the concept of a “patent litigation family,” which considers all cases that share one or more patents in common as part of the same family, which may also include foreign patents. The following chart illustrates the annual activity of U.S. district courts when it comes active patent litigation families per year. We have separated families with a single case and families with multiple cases. For 2017 and 2022, we have only covered the activity for half of the year.

Despite the ongoing challenges caused by the COVID-19 pandemic, patent litigation activity remains high, and as our data shows, the Western District of Texas continues to be one of the most active venues for patent litigation in the country. This high level of activity, combined with other factors, has made Austin a popular destination for big law firms. Several Am Law 100 firms have established a presence in Austin or expanded their patent practice in the city in recent years. The report further covers the 53 most important lateral moves for patent litigators that happened in 2022.
Companies may employ various strategies, including utilizing intellectual property rights in pre-litigation or International Trade Commission (ITC) Section 337 investigations to obtain injunctions, but the most popular venue for patent litigation remains U.S. district courts. Annually, there are 3,000 to 4,000 new patent cases filed in district courts across the country.
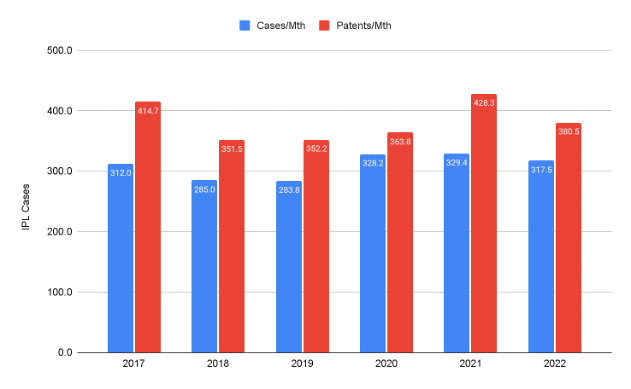
Year-over-year, district court patent litigation activity increased from 312.0 cases per month filed in 2017 to 317.5 per month (as of June 30) in 2022. However, for the full 2022 year, there were 3,772 patent case filings, a decrease from 3,953 in 2021, suggesting that the growth trend of patent litigation activity has slowed. The following chart illustrates the filing activity in recent years.
A total of 17,377 unique patents were at the center of these 18,493 patent cases. An analysis of these patents using International Patent Classification (IPC) codes revealed 535 different codes. The most frequently occurring code, G06F, was present in 28.4% of cases and relates to “electric digital data processing.” All of the top 10 IPC codes were related to electronics, communications, and/or semiconductor technologies.
During the five-year period analyzed, Texas, California and Delaware were the most popular states for patent litigation. Of the 18,493 patent case filings from July 1, 2017, to June 30, 2022, 30.9% (5,713) were filed in Texas district courts, 19.1% (3,533) were filed in California district courts, and 18.6% (3,448) were filed in Delaware district courts, comprising 68.6% of all patent cases filed during this period. The number of patent filings per state decreases significantly thereafter, with Illinois, New York and Florida accounting for 4.5%, 4.5%, and 3.6% of patent filings, respectively.
Case Milestones – Average Length for Termination
To gain a comprehensive understanding of the patent litigation landscape, Patexia conducted a thorough review of all docket reports to identify the key litigation milestones and the time frame from filing to termination for all cases. This data provides insight into the overall duration of patent litigation cases and can be used to identify trends and patterns in the patent litigation landscape. Additionally, this information can be used to better understand the time and resources required to successfully navigate the patent litigation process, providing valuable information for stakeholders such as patent holders, attorneys, and companies.
As seen above, 78.8% of the cases are terminated within a year, while the remaining 21.2% require more than a year. Looking closer, more than half of the cases are terminated within the first six months, while 11.4% of the cases are taking more than 18 months to be resolved.
Companies to Watch
The report looked at the activity of 20,065 companies and identified them as either a defendant or plaintiff over the course of this study to rank them as defendant, plaintiff, and overall. Samsung Electronics was the most active company overall and as a defendant, with 288 cases, and 900 unique patents. IP Edge LLC was the most active plaintiff, with a total of 1,026 cases, and 81 unique patents.
Most Litigated Patents
The top 10 most litigated patents in patent cases filed between July 1, 2017 and June 30, 2022 were as follows:
US6972790 – Host interface for imaging arrays – litigated in 179 cases
US6928442 – Enforcement and policing of licensed content using content-based identifiers – litigated in 175 cases
US7802310 – Controlling access to data in a data processing system – litigated in 175 cases
US8099420 – Accessing data in a data processing system – litigated in 175 cases
US8537242 – Host interface for imaging arrays – litigated in 168 cases
These patents, which are often litigated in the same cases, are assigned to Cedar Lane Technologies Inc, Personalweb Technologies LLC, and Level 3 Communications LLC.
Law Firms to Watch
In total, 3,608 law firms represented either defendants or plaintiffs in one or more of 18,493 patent cases (excluding firms acting as local counsel). Our analysis found that 2,469 firms represented plaintiffs and 2,365 firms represented defendants, with some firms appearing on both sides in different cases. Our study revealed that a small number of firms were highly active, resulting in a significant percentage of all cases being handled by a small number of firms. Some of these firms handle cases independently, while others receive assistance from local counsel in states with high activity such as Texas, Delaware, or California. To distinguish, we have separated local counsel and a separate section has been dedicated to active local counsel.
According to our analysis, Fish & Richardson was the most active patent litigation firm overall and for defendants. On the plaintiff side, Stamoulis & Weinblatt was found to be the most active firm.
Litigators to Watch
Patexia identified 17,052 attorneys (including local counsel) who were named on one or more patent cases. Out of this number, there were 16,585 attorneys who were identified as lead counsel and were representing defendants or plaintiffs (the remainder were local counsel). Out of a total of 16,585 attorneys, 10,839 represented plaintiffs, while 11,581 represented defendants. On average, attorneys representing defendants handled 3.7 patent cases, while attorneys representing plaintiffs handled 5 patent cases. Patent cases can be highly complex and require a skilled team of attorneys.
Our evaluation and ranking of patent litigators were based on their activity and performance, considering several key metrics such as the number of cases they were involved in, the number of patents at stake, and the ultimate outcomes of those cases, and whether the side they represented came out stronger from the litigation. Each of the performance and activity rankings is broken down into three categories: defendant, plaintiff, and overall. Here below you will find a list of the top 50 most active patent litigators overall
Neil J. McNabnay of Fish & Richardson was the most active attorney overall and the most active attorney for defendants. Isaac P. Rabicoff of Rabicoff Law was the most active attorney representing plaintiffs.
The 50 Most Active Patent Litigators of 2023 (Defendants and Plaintiffs)


