Modeling and Quantifying Risk Probabilities
“Flexible risk models are crucial for effective intellectual property management, offering tools to navigate the trade secret landscape.”
Being able to quantify risk probabilities for a trade secret helps owners make strategic decisions in intellectual property management, such as choosing the type of intellectual property protection, considering opportunities for M&A, licensing, and improving the reliability of protection. As a result, this quantification enables the extraction of more value from intellectual property, particularly when managing middle- and large-sized IP portfolios. Let’s explore one possible approach to quantification by modeling an example case, quantify probabilities for risks derived from both the competitor and owner and its influence on Expected Monetary Value (EMV), and then discover some non-trivial suggestions for improving the efficiency of trade secret management.
Changes in Investment and IP Management
Figure 1
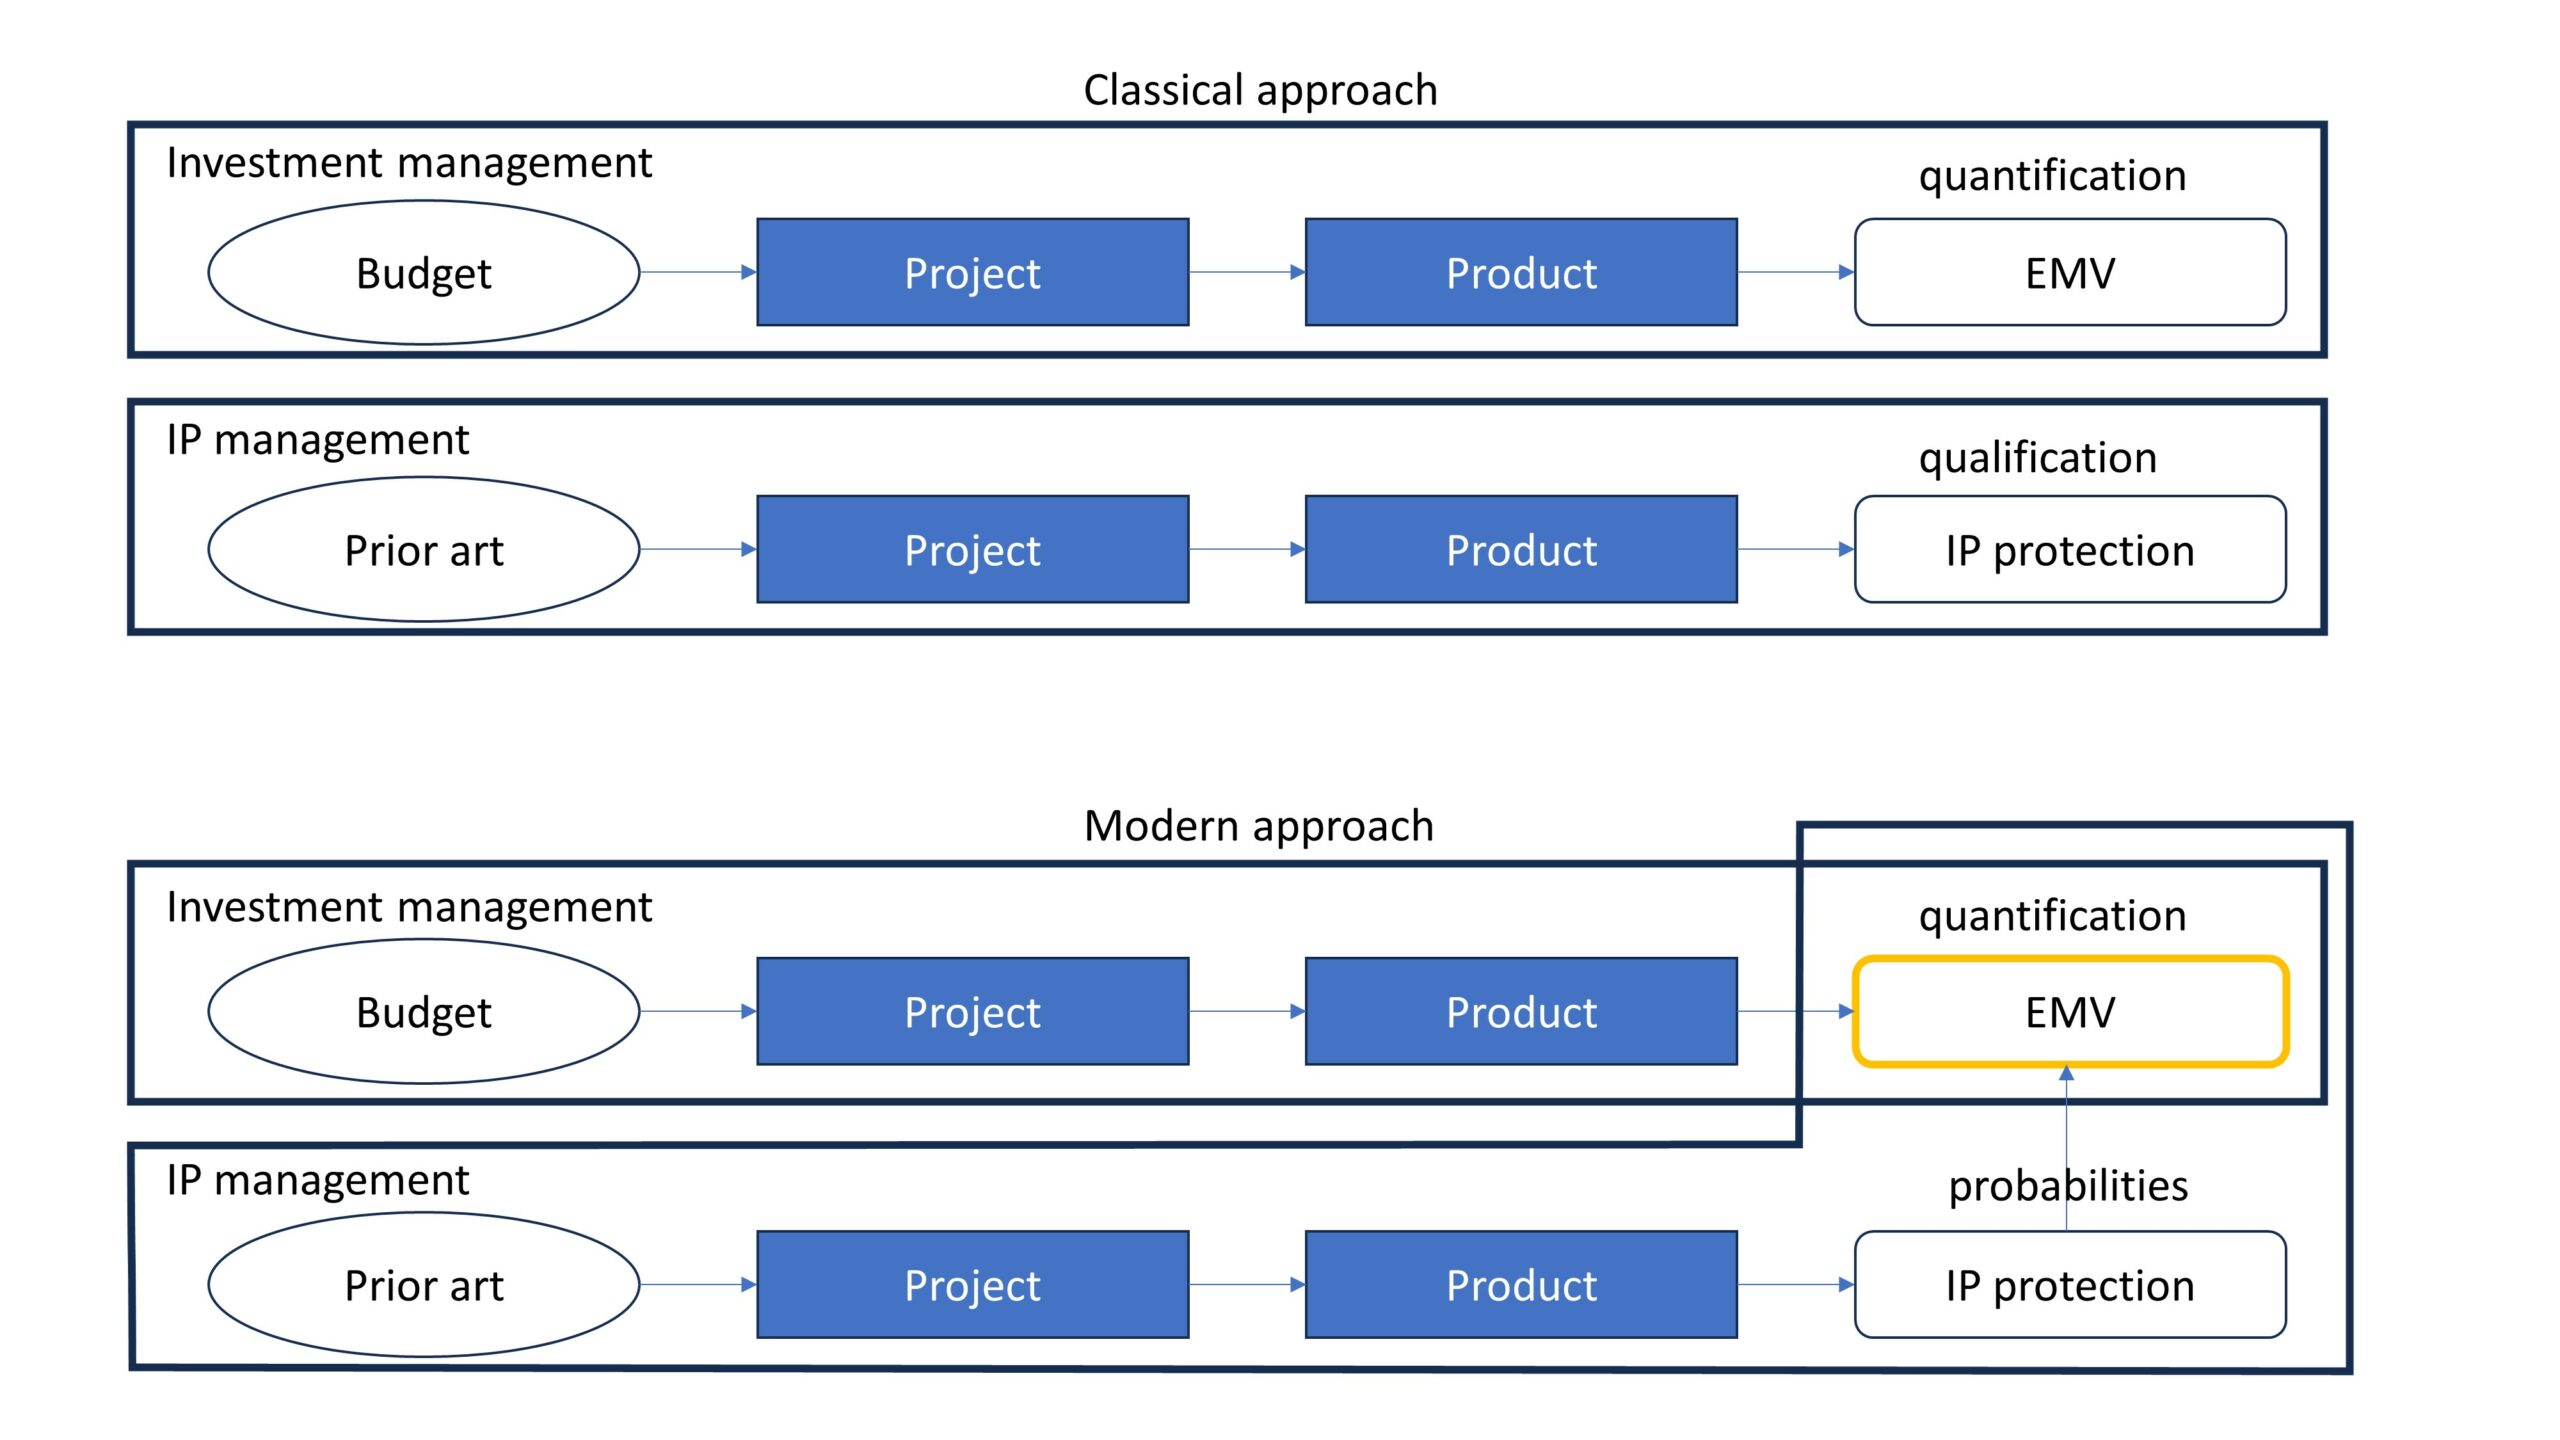
The need for the quantification of risk probabilities arises from shifts in the relationships between investment and intellectual property (IP) management. In the classical approach, the processes of investment management and IP management viewed the same R&D project differently (see Figure 1). The primary outcome of IP management was a certain level of protection, which didn’t have strong connections with the cash flows and EMV of a project considered in investment management.
But the gap between the results of IP management and investment management meant that investment decisions did not consider IP protection as a lever for extracting additional value from the results of an R&D project and as an additional risk. At the same time, decision-making about IP protection did not take into consideration changes in the EMV of the project.
If the results of IP management and investment management are connected, then one can improve both. In investment management, it allows to obtain a more precise evaluation of EMV, and in IP management, to identify the parameters of protection that provide extracting the maximum value from both the IP and the project as a whole.
Since EMV is the sum of the probability for each event multiplied by the impact of that event, connecting IP protection with EMV requires calculating risk probabilities and multiplying them by corresponding impacts.
Goal and Methodology
The goal of the suggested approach is to offer models and numerical values for evaluating probabilities for calculating EMV and for other analytical tasks. The approach, models, and parameters are based on the author’s broad experience of playing a role on both sides of the issue as the owner of a trade secret and as a competitor.
Figure 2
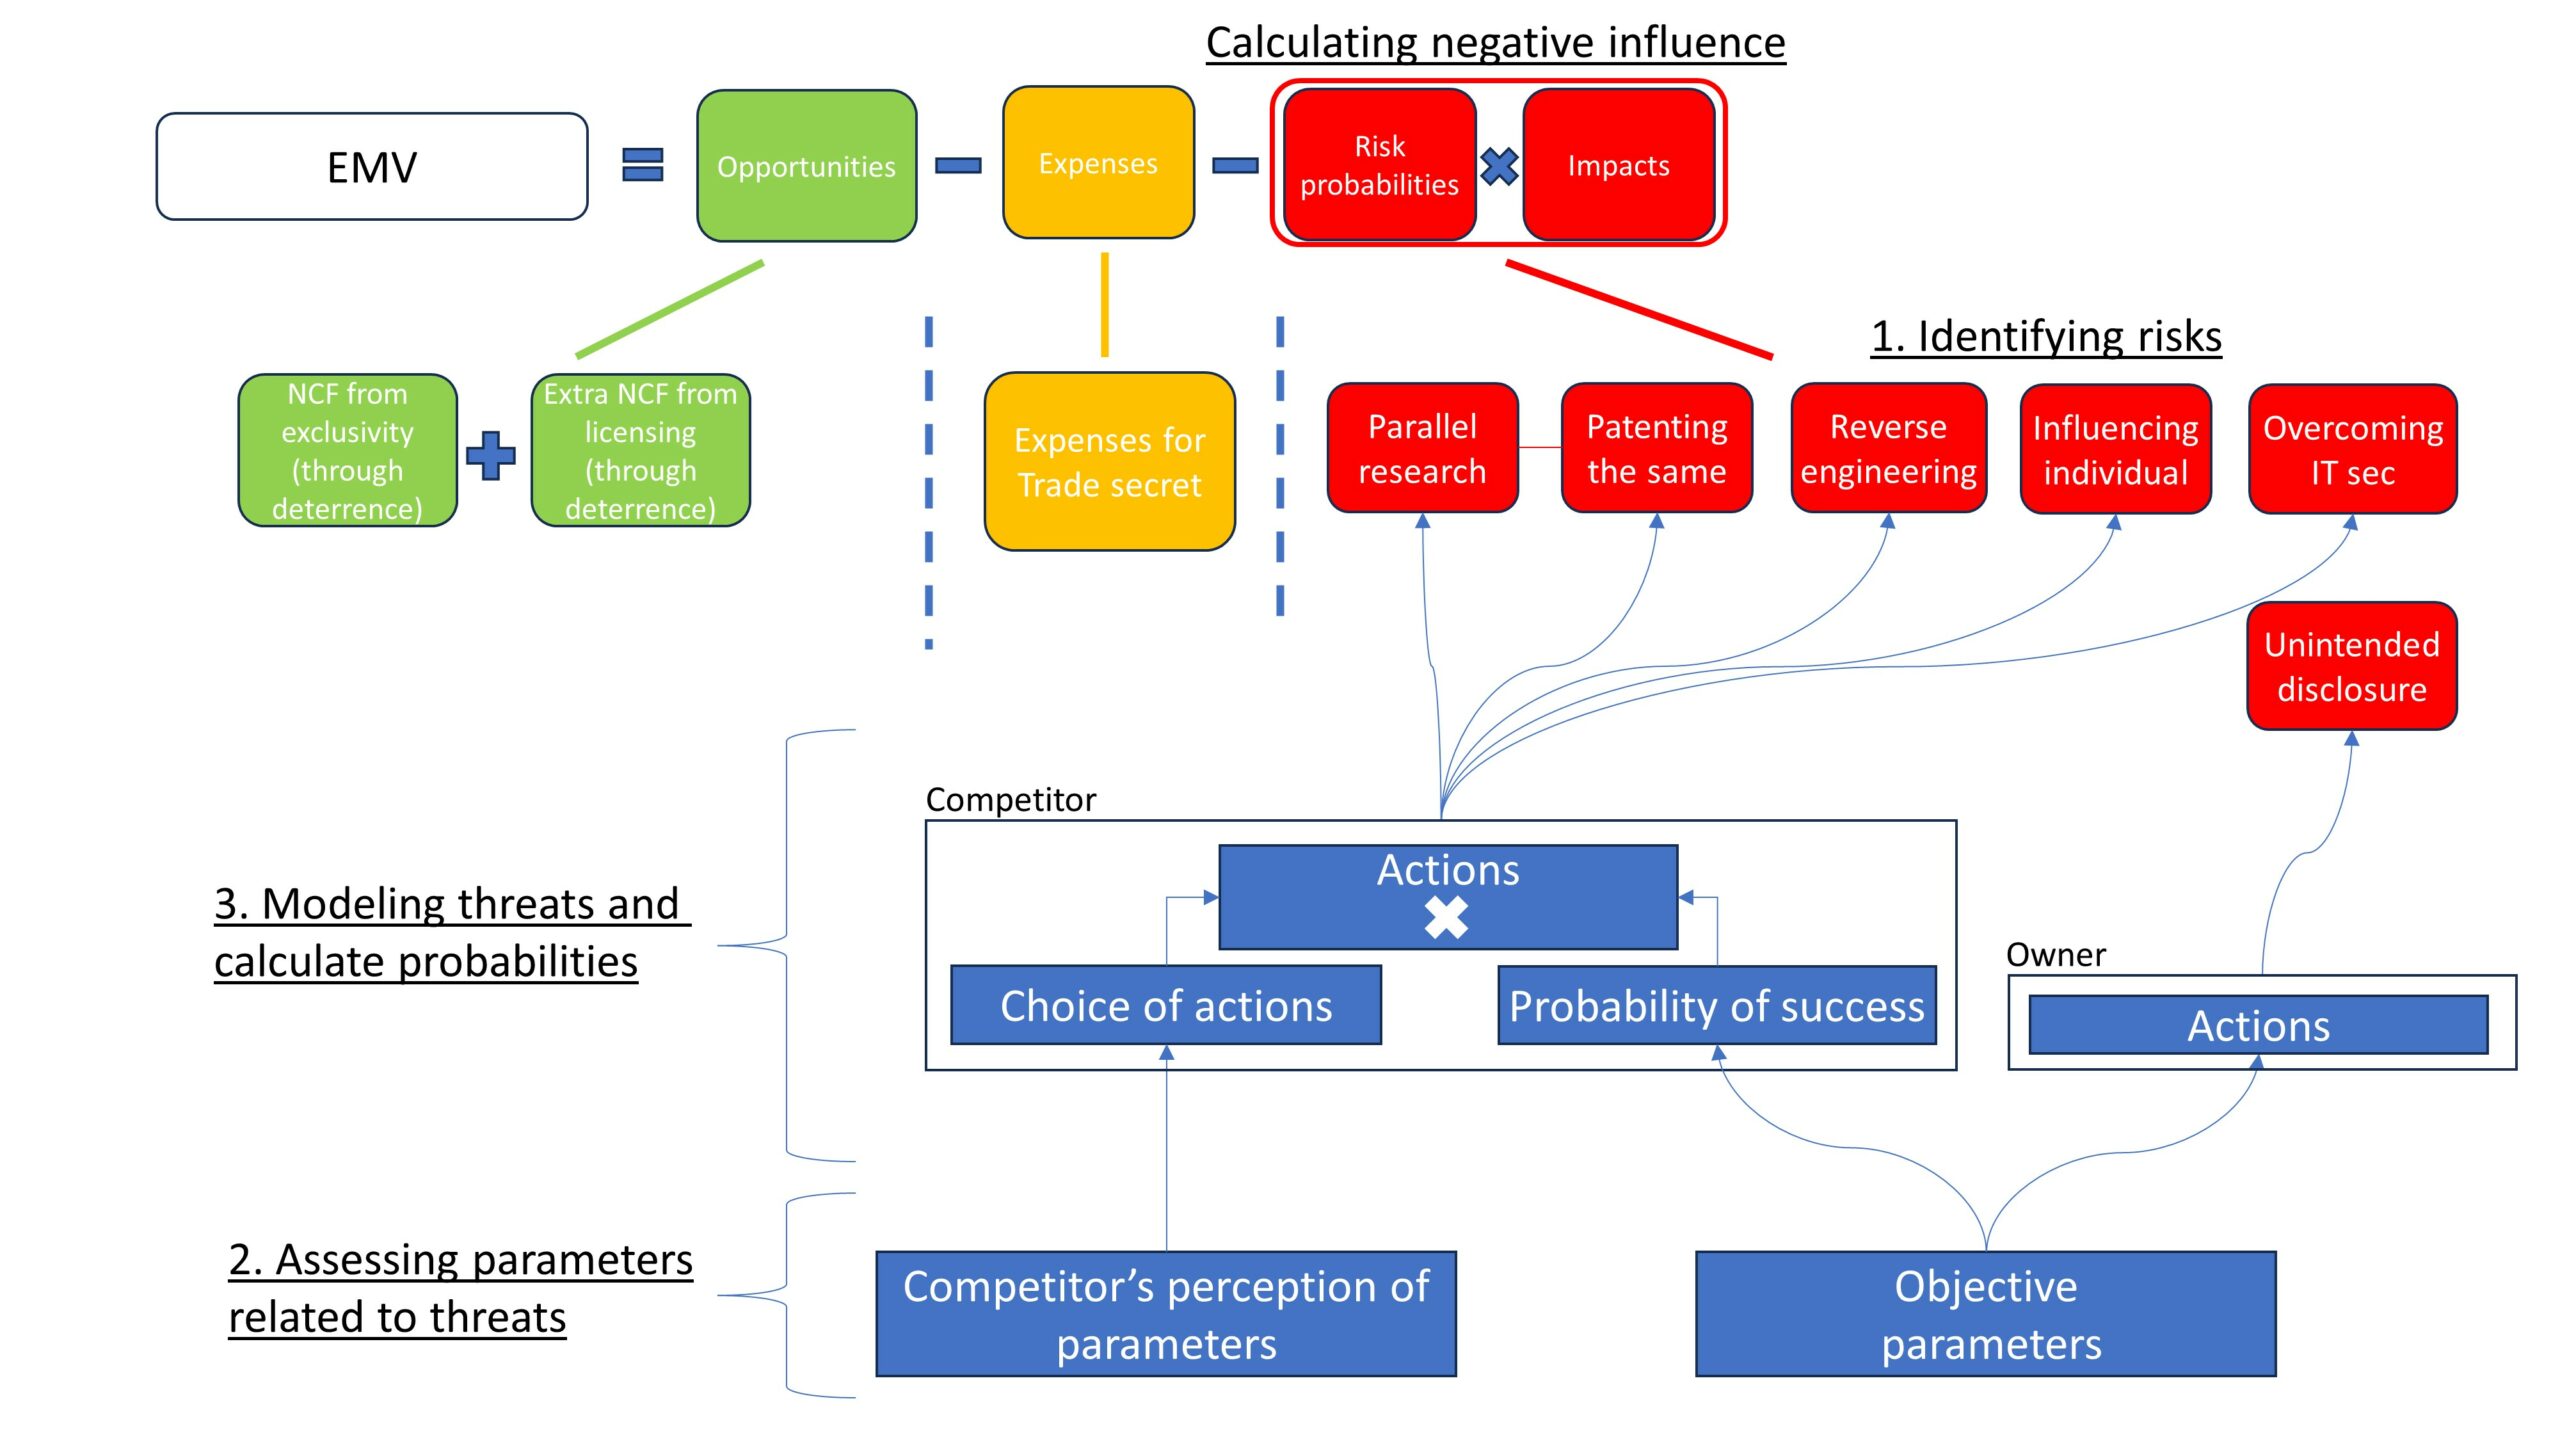
The methodology for quantifying risk probabilities involves three steps (see Figure 2):
- Identifying risks
- Assessing parameters related to threats
- Modeling threats and calculate probabilities
After modeling threats and obtaining probabilities, one can multiply these probabilities by their respective impacts and calculate the specific negative influence on EMV in numerical terms. An example is provided below.
Identifying Risks
Risks to confidentiality and potential exploitation of the trade secret by competitors can arise from two sources:
- A competitor’s actions (intentional); and
- An owner’s actions (unintentional).
The competitor can act in four main ways that pose risks to the trade secret:
- conducting research and development (R&D) projects in the form of parallel research to discover equal or identical information;
- ?conducting R&D in the form of reverse engineering to obtain the same information;
- Influencing an individual who possesses the information to share it; or
- Bypassing IT security measures to access the information.
Moreover, conducting parallel research carries the risk of patenting the same technical solution as the owner’s trade secret. This risk is significant because if a competitor secures exclusive patent rights to the information covered by a trade secret, it severely limits the primary owner’s ability to derive value from it.
In addition to the competitor, the owner itself can pose a threat through unintended disclosure.
The probability of each risk is calculated by processing specific case parameters in threat models.
Assessing Parameters Related to the Competitor’s Threats
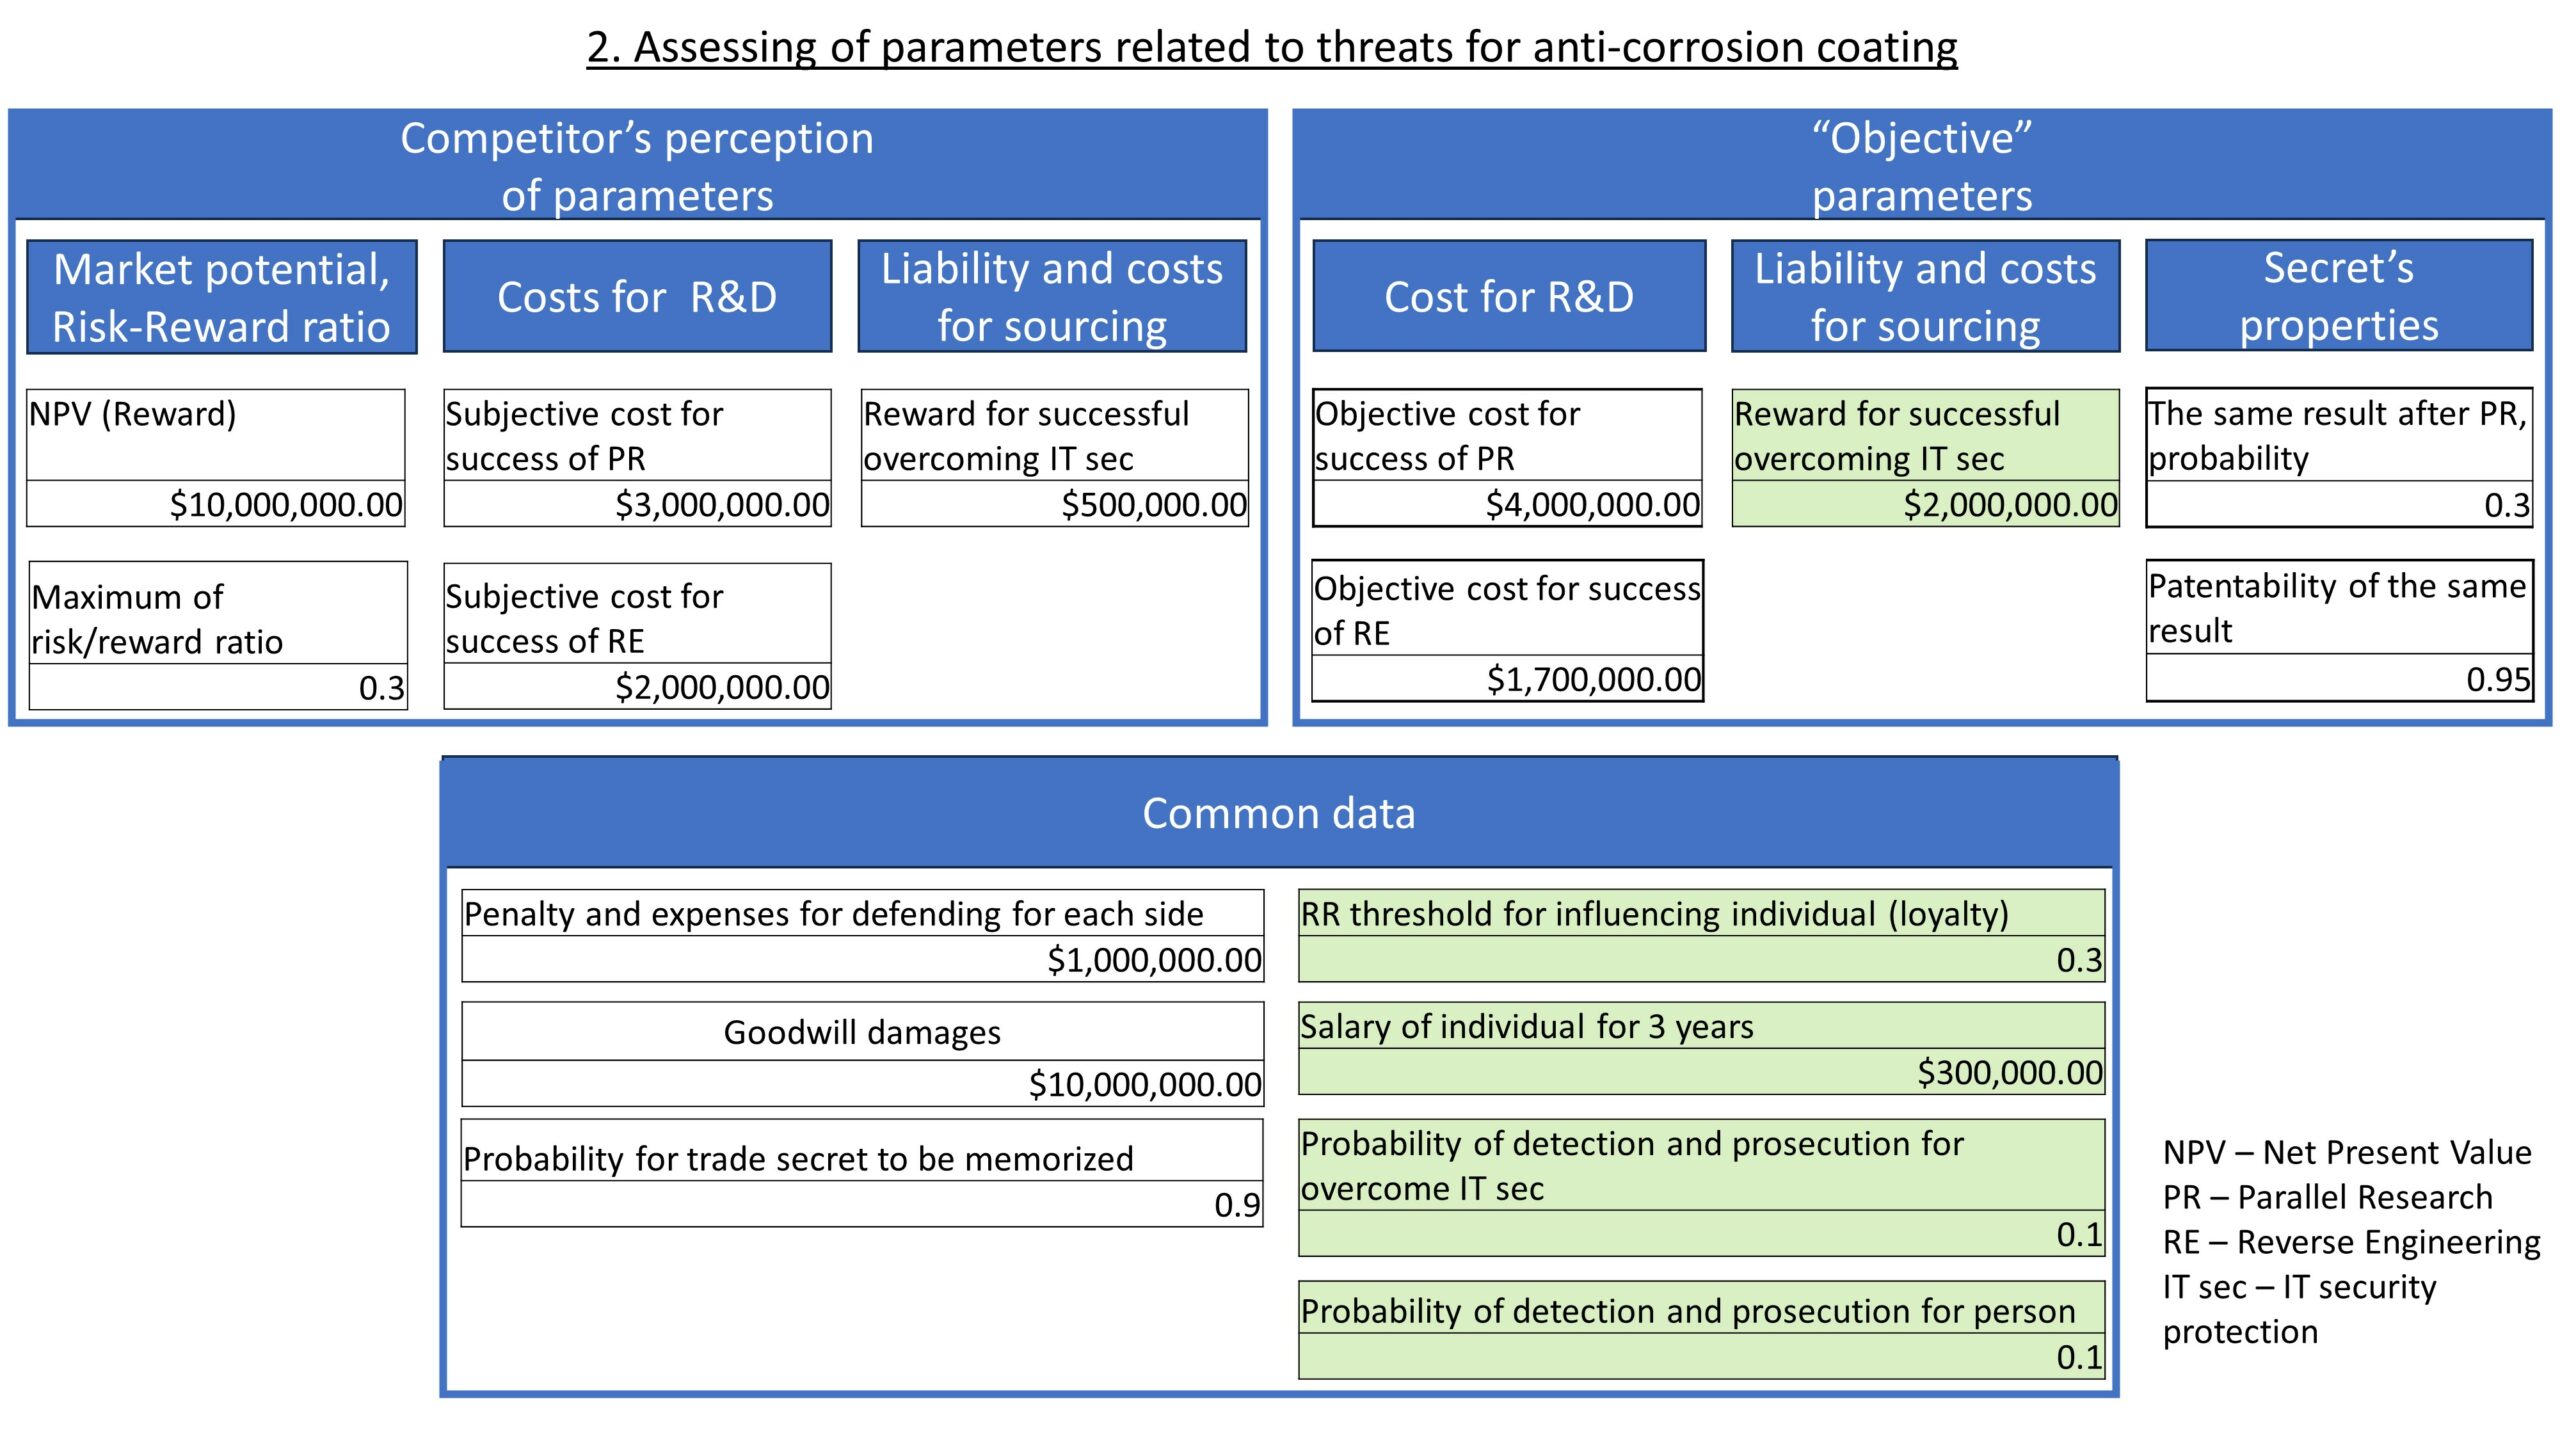
Let’s take a hypothetical example of a trade secret that includes information about a new method for anti-corrosion coating. Quantifying the risks associated with such a trade secret can help the owner make decisions, such as whether to patent the invention covered by the trade secret, maintain its secrecy, consider licensing, or implement measures to enhance protection. Figure 3 shows the parameters of this example.
Figure 3
Parameters related to the competitor’s threats are categorized into three groups:
- The competitor’s perception of parameters, which define the subjective behavior of the competitor;
- The “Objective” parameters, such as the costs for R&D and the liability and costs for sourcing, known better by the owner, and determining the success of the competitor’s actions; and
- Common data that is the same for both the competitor and the owner.
The primary methods for assessing these parameters are collecting historical data and expert opinions. These parameters become crucial in the subsequent step when modeling the threats.
Modeling Threats and Calculating Probabilities
Figure 4
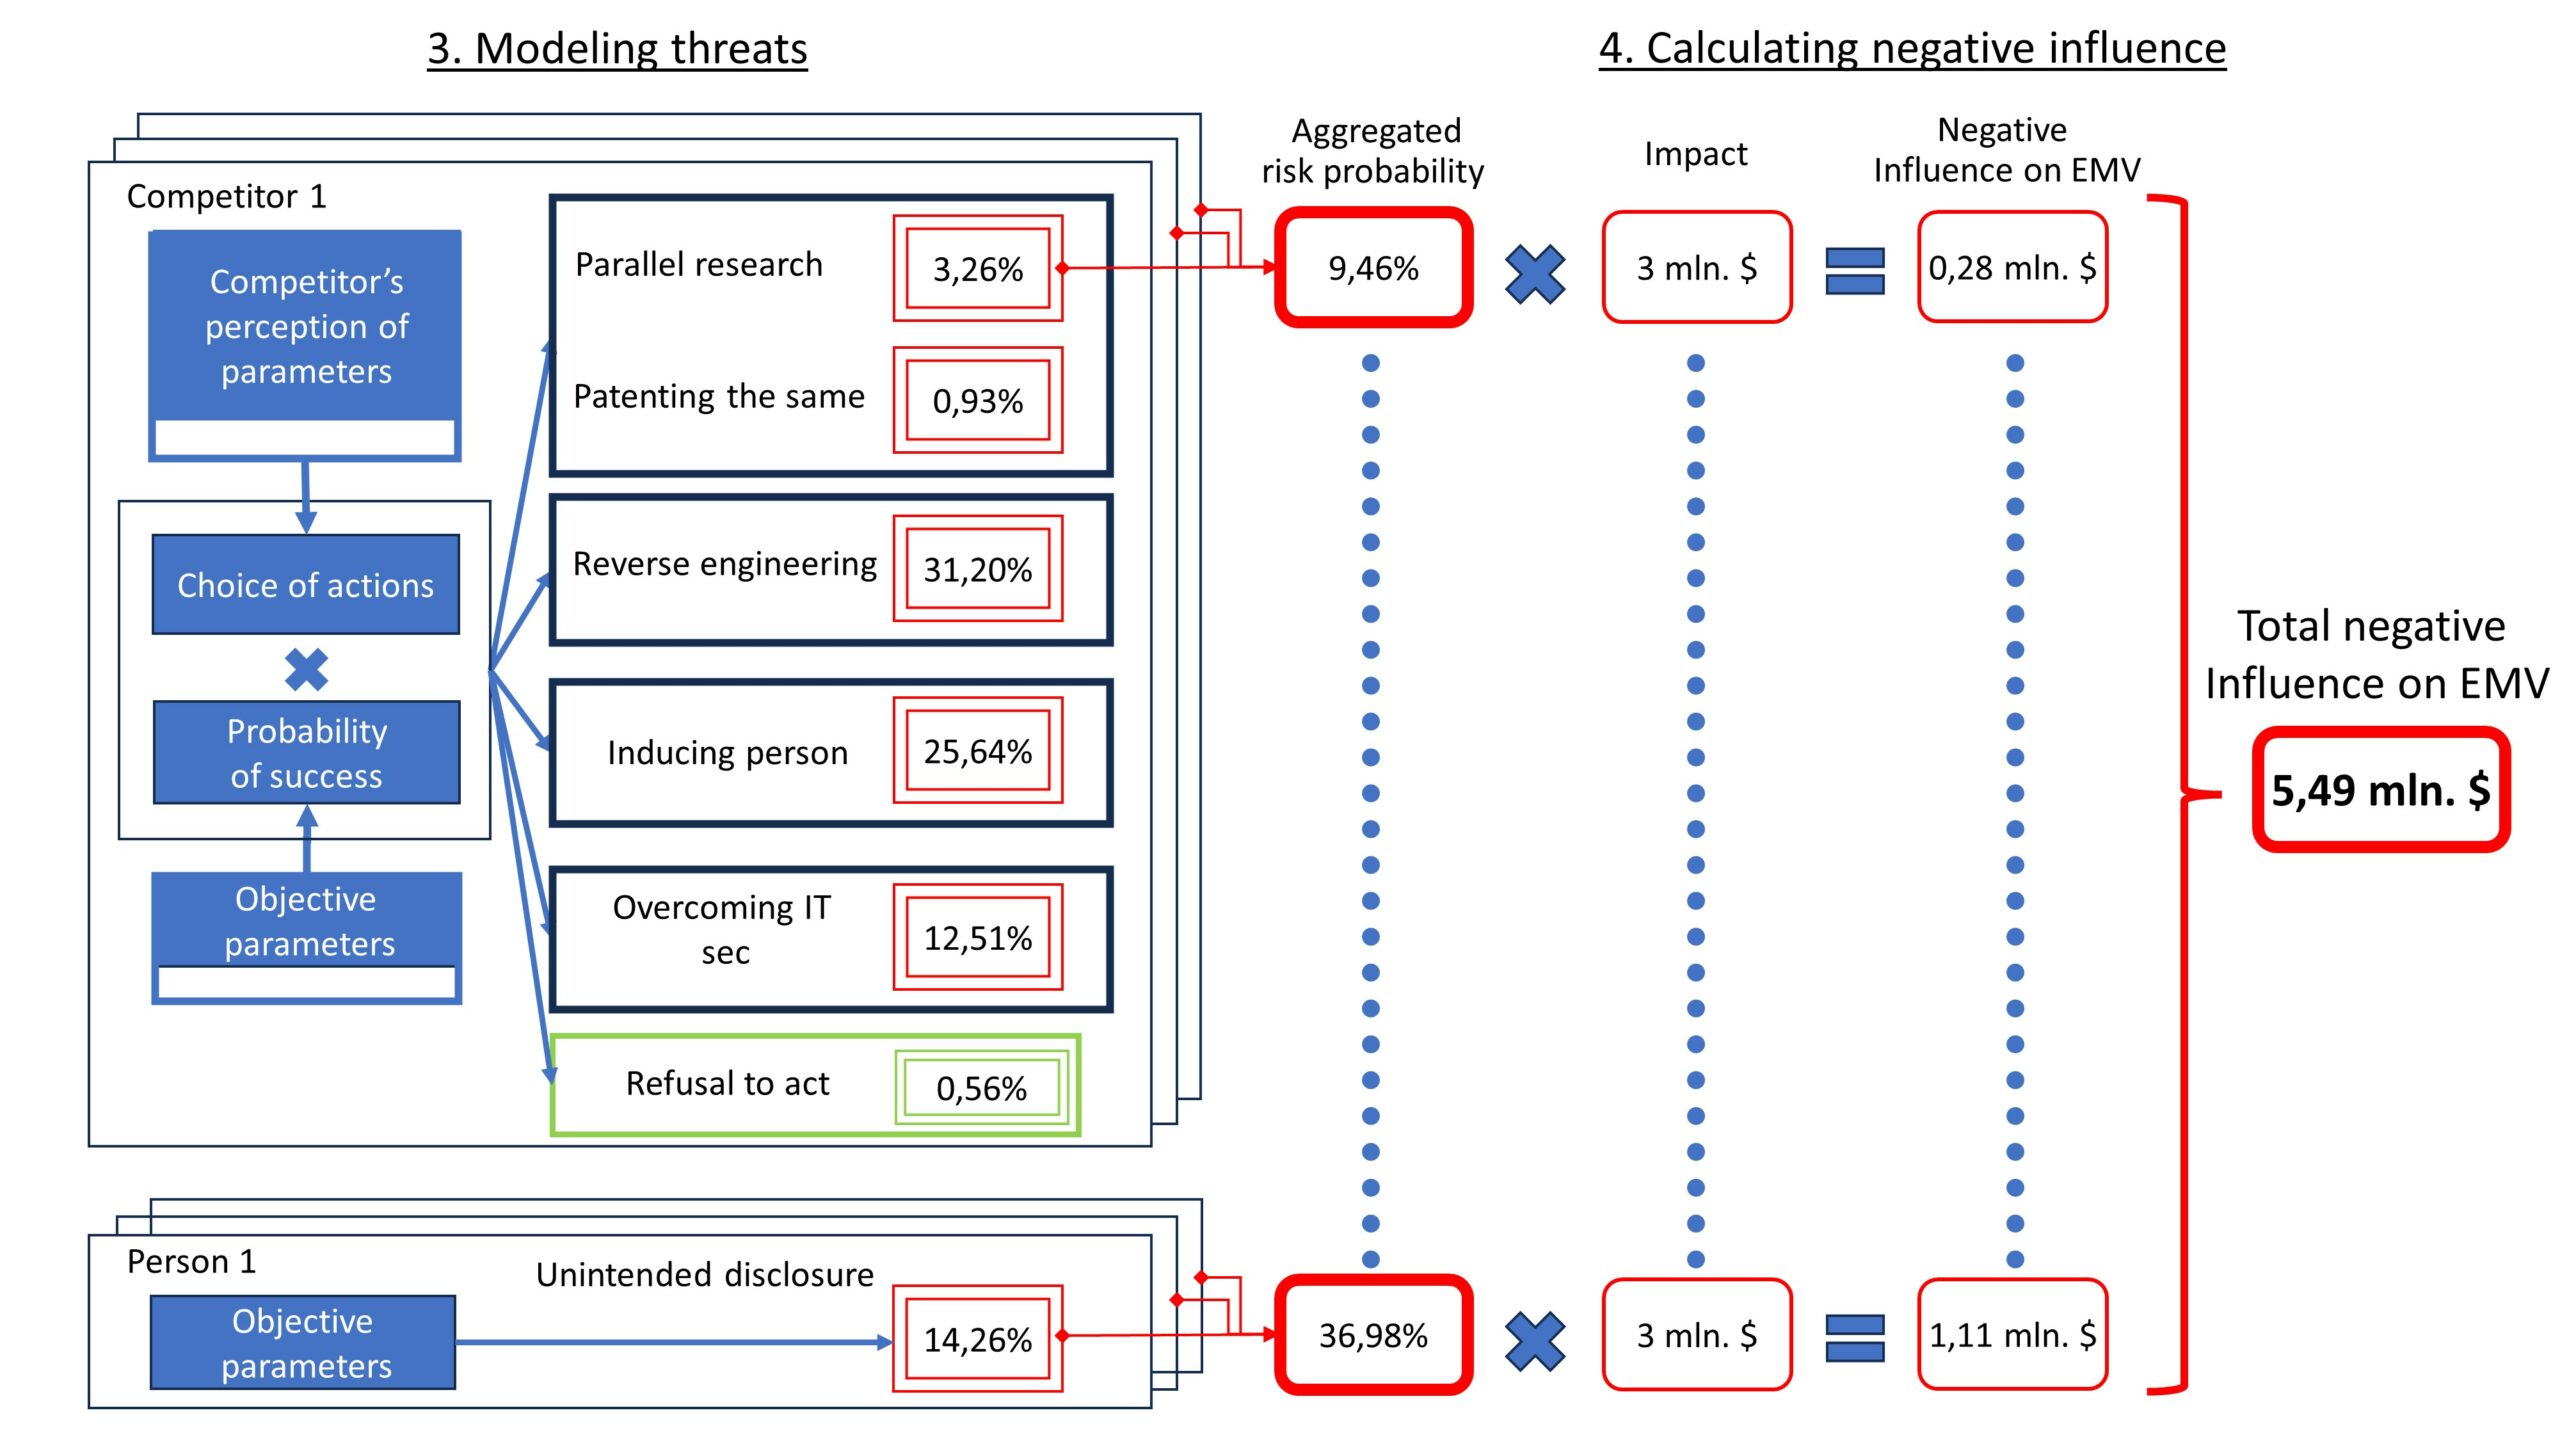
As illustrated in the left part of Figure 4, the probabilities of risks result from the following steps:
- Calculating the probability of the competitor choosing a specific type of action;
- Calculating the probability of success for that type of action;
- Multiplying the probability of choosing and the probability of success;
- Aggregating probabilities throughout engaged competitors and individuals.
The calculation of the probability of choosing and the probability of success is based on the evaluation of 17 parameters shown in Figure 3.
The row of red frames in Figure 4 presents the calculated probabilities of all types of risky events for a single competitor and for one person carrying the trade secret.
Each competitor and individual introduces an additional threat to confidentiality. Therefore, it becomes crucial to aggregate the probabilities associated with each actor. The aggregation process is based on the formula for the union of independent events from probability theory. For simplicity, this calculation assumes uniform parameters across all competitors and individuals.
In the middle of Figure 4, a row of red rounded rectangles should display the aggregated result for each type of risk involving 3 competitors and 3 individuals. However, for ease of perceiving the process, this row is simplified by representing it with dots instead of the full row. The subsequent step involves determining the influence on EMV resulting from these aggregated risks.
Calculating the Total Influence of Risks on EMV
The negative influence on EMV results from the multiplication of risk probabilities and the impacts of these risks, as illustrated in Figure 4. Impacts of risks can be assessed based on the amount of reduction in positive cash flow in the event of occurrence. While impacts may vary for each type of risk, some evaluations might be similar.
For instance, as shown in Figure 4, if the competitor succeeds in parallel research, the owner of the trade secret incurs a loss of $3 million, and considering probability the negative influence on EMV from this risk will be $0.28 million. In the case of unintended disclosure, where the owner also loses $3 million, the higher probability of risk results in an influence on EMV amounting to $1.11 million.
The total negative influence on EMV is the sum of all calculated numbers, resulting in $5.49 million, as depicted in the right part of Figure 4 within the bold red rounded rectangle.
With all parameters and results in hand, the owner now has the opportunity to analyze the outcomes and the entire model.
Analysis of the Results and the Model
The knowledge of the total negative influence allows the owner to evaluate IP protection numerically and provides an opportunity to analyze the situation by changing different parameters and observing the resulting impact on EMV.
For example, the owner can calculate, using another model, the influence on EMV in the case of protecting the same technology in the form of a patent. Then, one can compare the results with the model for trade secrets, and if the negative influence on EMV from risks derived from patent protection is less than $5.49 million, decide to implement patent protection instead of trade secret.
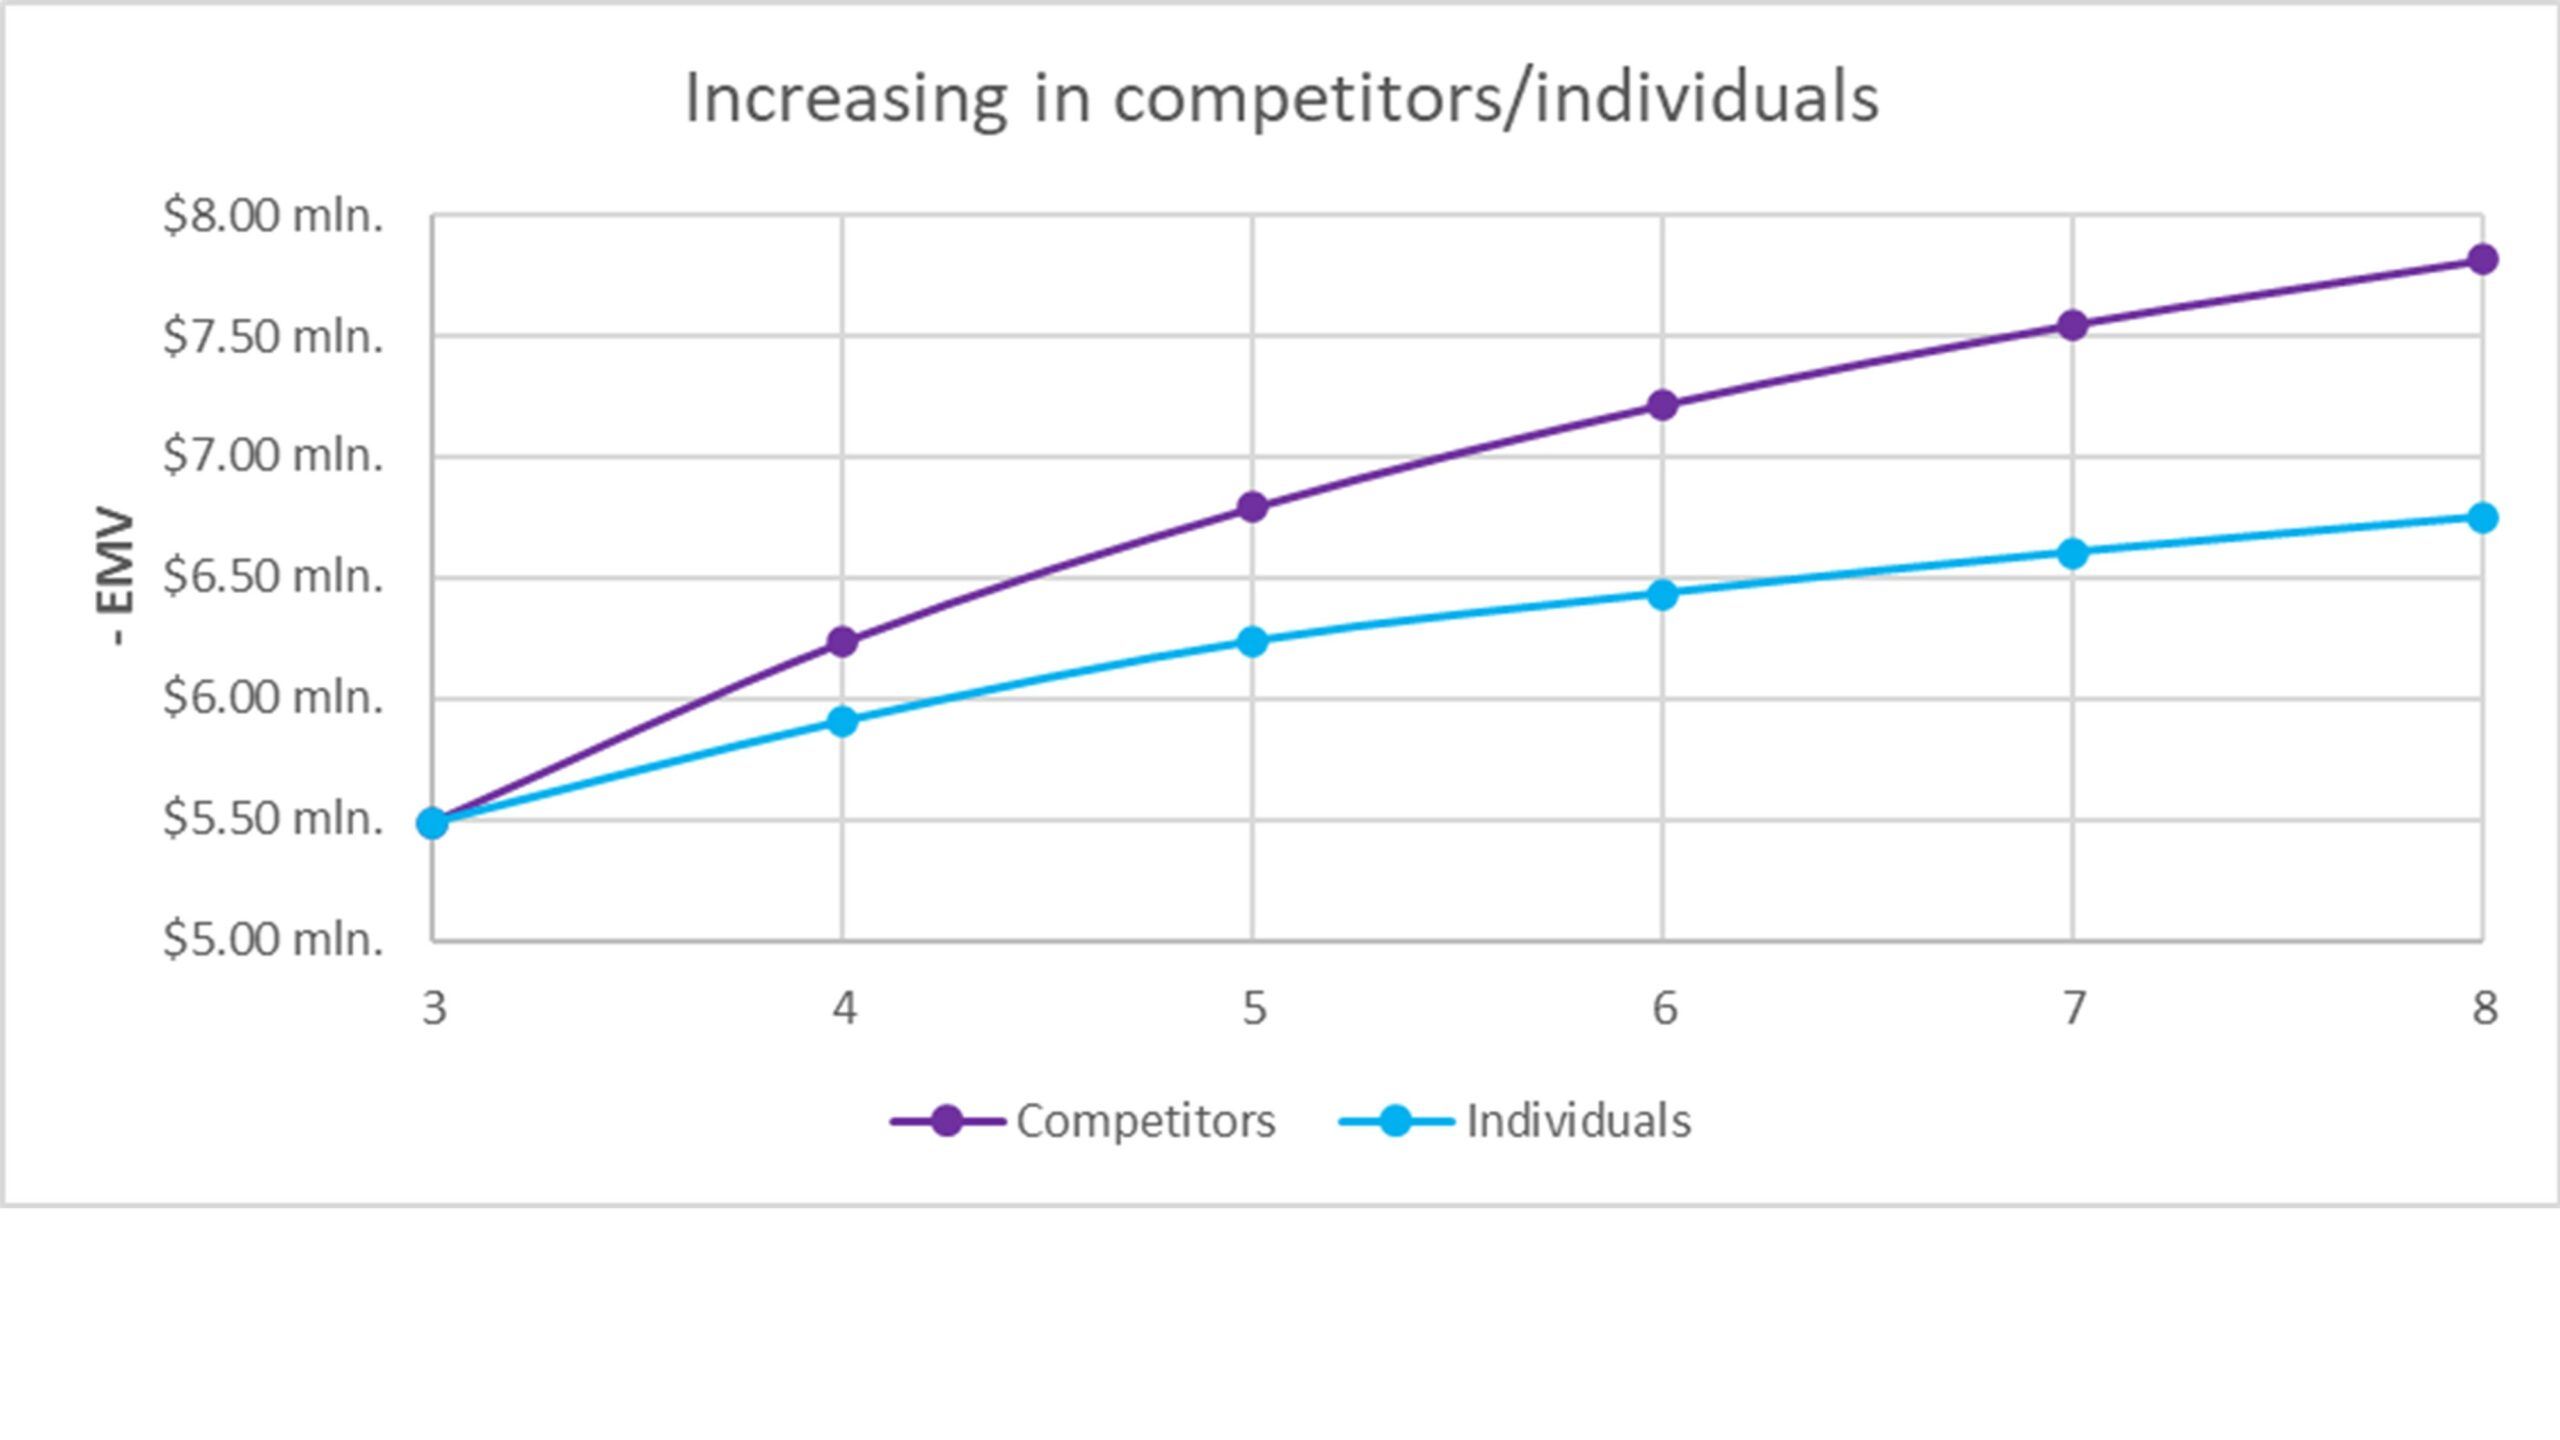
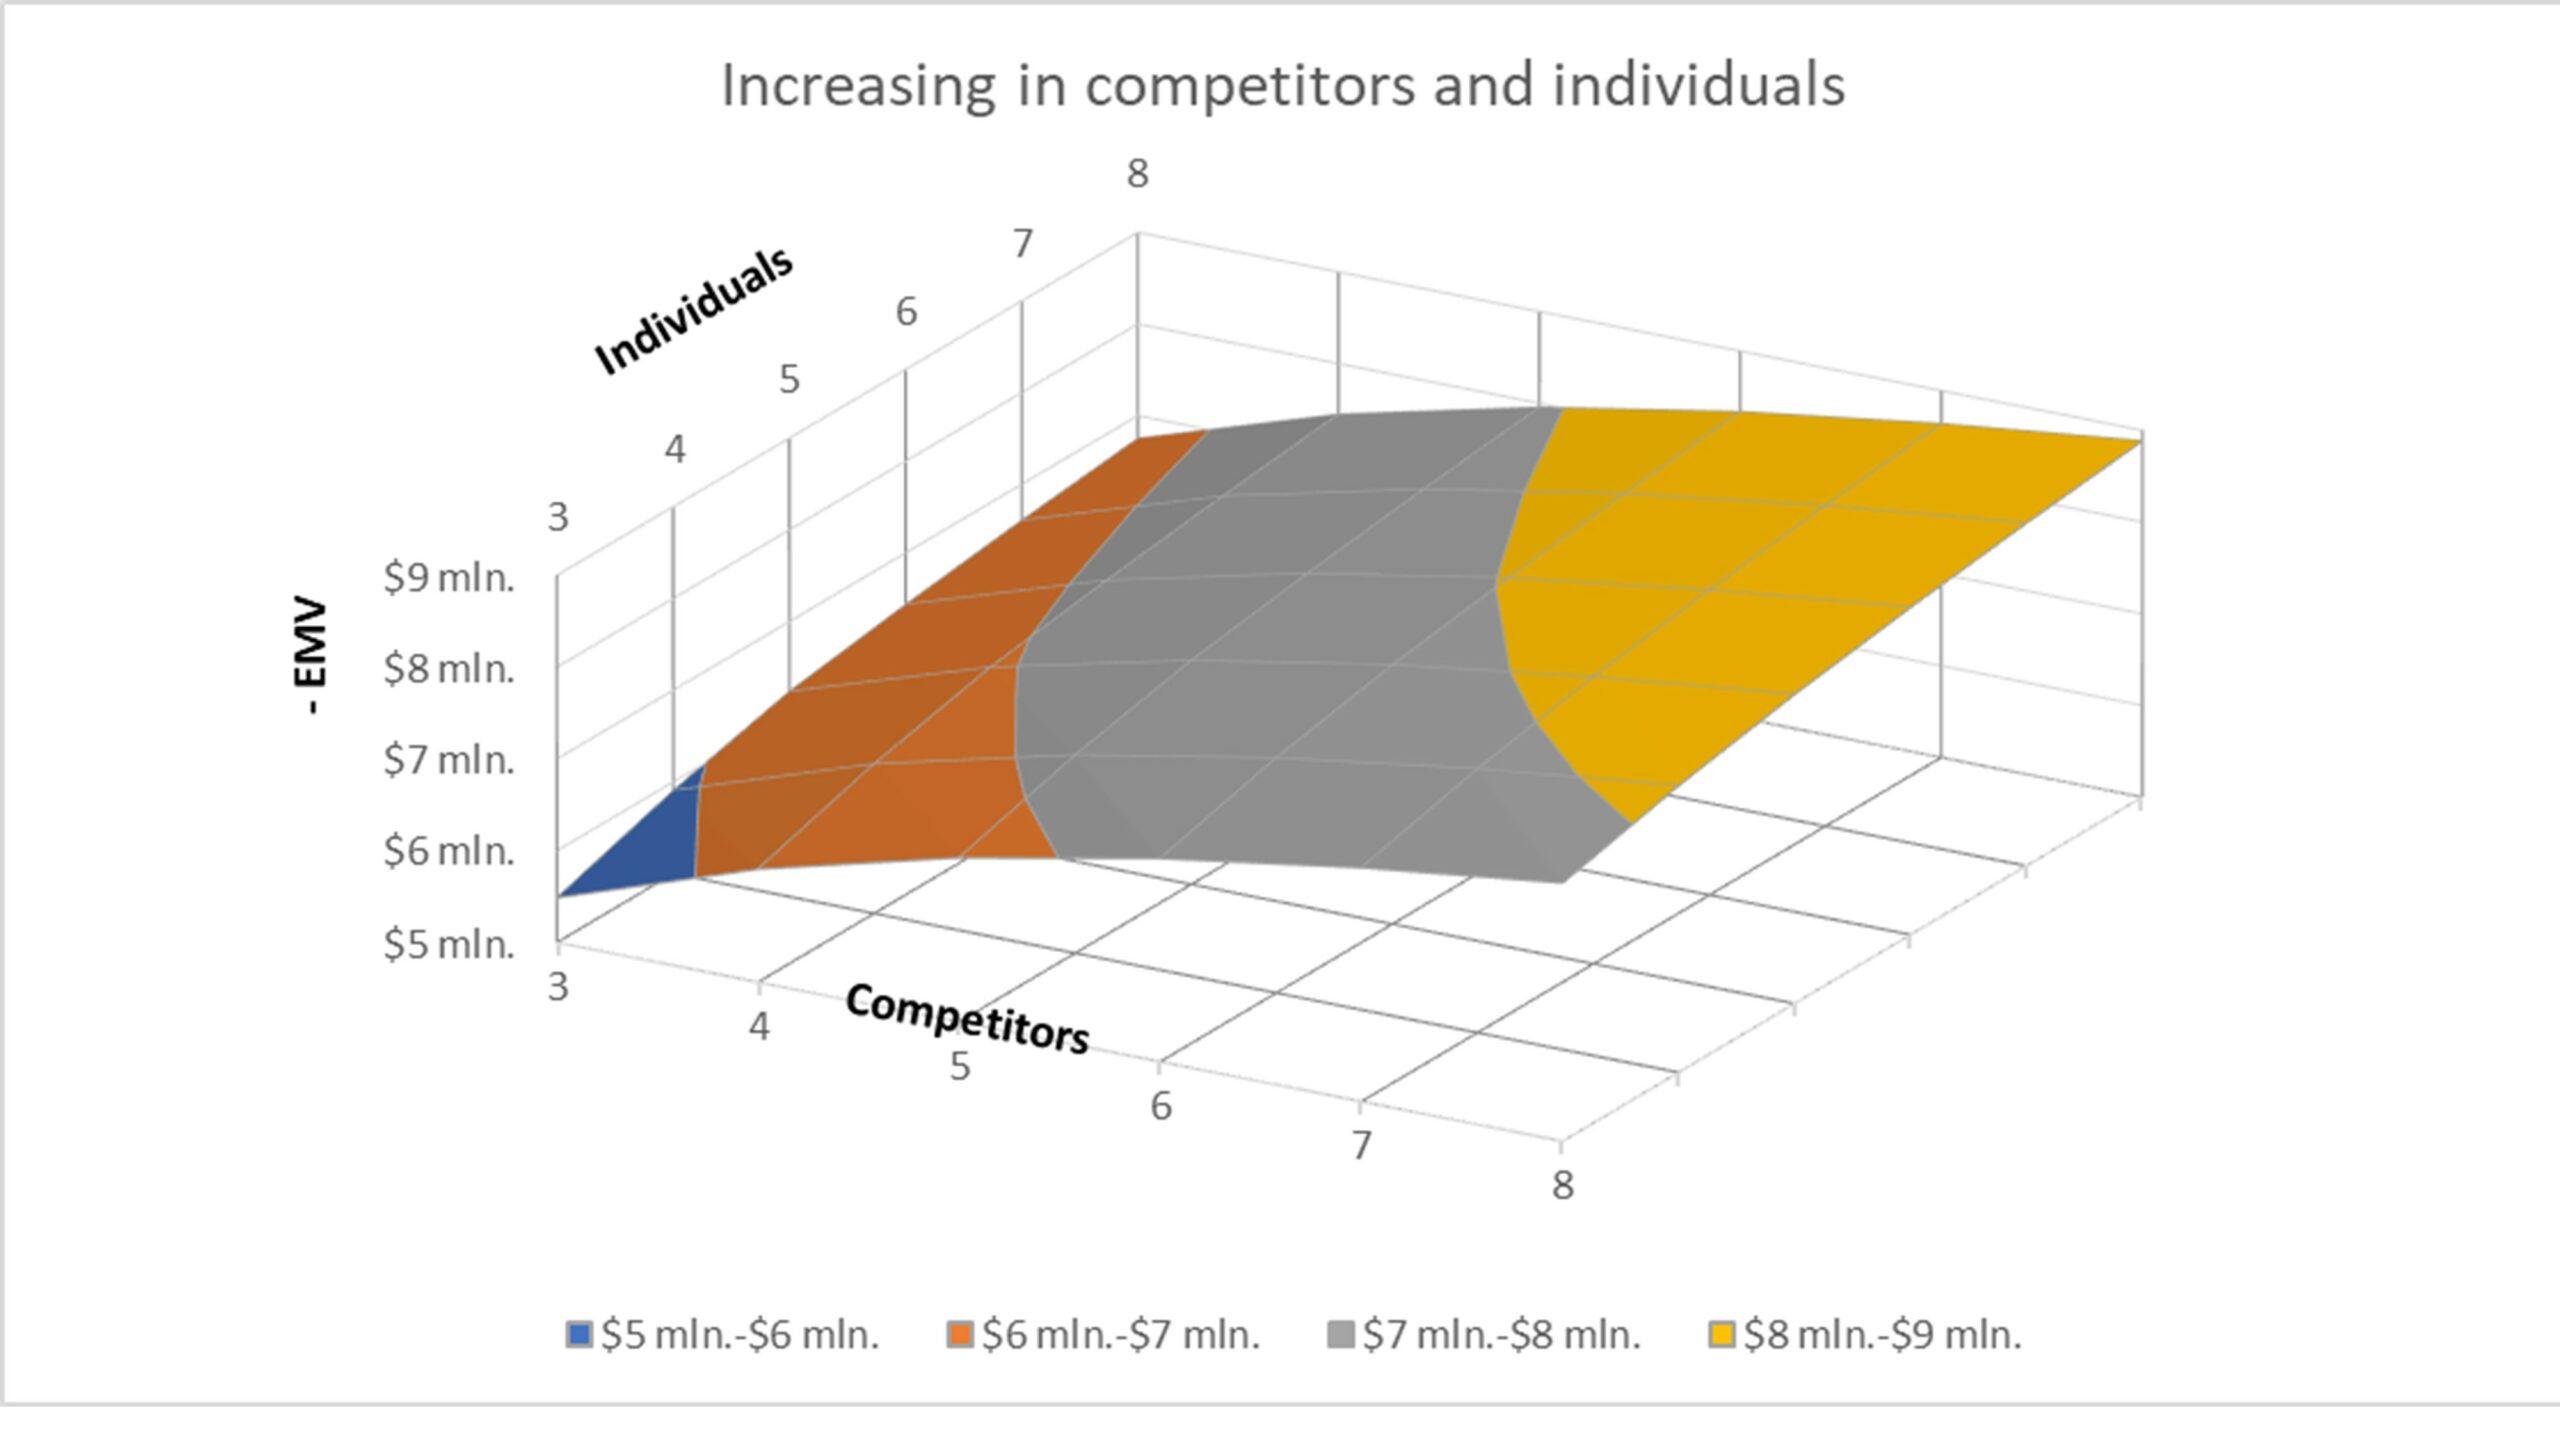
Exploring the model by adjusting parameters, such as the number of competitors and individuals (see Figure 5 and 6), can bring additional value.
Figure 6
Throughout the technology lifecycle, the market undergoes changes, typically marked by an increase in the number of competitors. Consequently, each new competitor elevates risk probabilities, leading to a heightened negative impact on EMV. For instance, in the given example, increasing the number of competitors from 3 to 5 results in a $1.3 million rise in negative EMV impact (see Figure 5). Conversely, a reduction in competitors can mitigate risks and diminish the negative influence on EMV. These calculations are relevant not only in the context of a growing market but also during merger and acquisition operations involving competitors.
When assessing the potential for a license agreement, it is crucial to recognize that employees of the licensee would become additional carriers of the trade secret. In the example case, increasing the number of individuals from 3 to 6 results in a corresponding increase in negative influence on EMV approximately $1 million. Therefore, the positive cash flow from the license agreement should ideally compensate for this negative impact. Additionally, Figure 5 illustrates that the additional risk from increasing the number of individual carriers by 3 persons is comparable to the risk introduced by adding a new competitor to the market.
To visualize the entire range of potential outcomes based on changes in both parameters, a 3D graph in the form of a surface can be constructed (see Figure 6). This graph illustrates the dynamics of negative influence on EMV in the context of varying numbers of competitors and individuals.
Another application of the model is to strengthen the protection of the trade secret. In Figure 2, parameters that can be improved by the owner are marked in green. One can assess the sensitivity of these parameters by making adjustments, analyzing the resulting changes in calculations and graphs, and thereby identify effective measures to reduce risk probabilities and enhance protection.
Researching models by changing various parameters can lead to discovering non-trivial suggestions for improving the efficiency of trade secret management. Some of them are outlined below.
Suggestions for Improving the Efficiency of Trade Secret Management
- Keep the number of individuals who are carriers of a trade secret as low as possible because increasing the number of carriers for several people could elevate the probability of risks, equivalent to the emergence of a new competitor in the market.
- In IT security protection and information management, aim to maximize the probability of detecting and identifying the person sharing the information, as it is the most crucial parameter for deterrence.
- In situations with a high probability and impact of risks associated with trade secret leakage, opting for patent protection or licensing the trade secrets to a competitor under favorable conditions may be a better decision. In either case, at least one party would gain access to the information beyond the owner’s control.
Flexible risk models are crucial for effective intellectual property management, offering tools to navigate the trade secret landscape. By incorporating industry-specific parameters these models become valuable assets facilitating informed decision-making, extracting value and enhancing protection for intellectual property.
Image rights acquired by AdobeStock


